SpectrumSampler
- class msaexp.spectrum.SpectrumSampler(spec_input, oversample_kwargs={'factor': 5, 'pad': 12}, with_sensitivity=True, **kwargs)[source]
Bases:
objectHelper functions for sampling templates onto the wavelength grid of an observed spectrum
- Parameters
- Attributes
Attributes Summary
Metadata of
spectableMethods Summary
bspline_array([nspline, step_size, ...])Initialize bspline templates for continuum fits
drizzled_hdu_figure(**kwargs)Run
drizzled_hdu_figureon array dataemission_line(line_um[, line_flux, ...])Make an emission line template - deprecated in favor of
fast_emission_linefast_emission_line(line_um[, line_flux, ...])Make an emission line template with numerically correct pixel integration function
fit_single_template(template[, z, spl, ...])Resample and fit a template to the spectrum
igm_absorption(z[, scale_tau, scale_disp])Inoue+ (2014) IGM absorption
initialize_emission_line([nsamp])Initialize emission line
initialize_spec(spec_input, **kwargs)Read spectrum data from file and initialize attributes
load_sensitivity_curve([sens_file, prefix, ...])multiplot([sx, sy, z, ny, xpad, ...])Make a plot of the spectrum split into wavelength intervals
oversampled_wavelengths([factor, pad])Generate a wavelength grid that oversamples the spectrum wavelengths
redo_1d_extraction(**kwargs)Redo 1D extraction from 2D arrays with
make_optimal_extractionresample_bagpipes_model(model_galaxy[, ...])Resample a
bagpipesmodel to the wavelength grid of the spectrum.resample_eazy_template(template[, z, ...])Smooth and resample an
eazy.templates.Templateobject onto the observed wavelength grid of a spectrumAttributes Documentation
- spec = {}
- spec_R_fwhm = None
- spec_wobs = None
- valid = None
- wave_step = None
Methods Documentation
- bspline_array(nspline=13, step_size=None, remap_arrays=None, minmax=None, log=False, by_wavelength=False, get_matrix=True, orders=[1, 2, 3, 4])[source]
Initialize bspline templates for continuum fits
- Parameters
- nsplineint
Number of spline functions to sample across the wavelength range
- logbool
Sample in log(wavelength)
- by_wavelengthbool
If True, sample bspline functions across the wavelength range. If False, sample bspline functions across the index range.
- get_matrixbool
If True, return array data. Otherwise, return template objects.
- Returns
- bsplarray-like
bspline data, depending on
get_matrix
- drizzled_hdu_figure(**kwargs)[source]
Run
drizzled_hdu_figureon array data- Parameters
- kwargsdict
Keyword arguments passed to
drizzled_hdu_figure
- Returns
- fig
Figure Spectrum figure
- fig
- emission_line(line_um, line_flux=1, scale_disp=1.0, velocity_sigma=100.0, nsig=4, **kwargs)[source]
Make an emission line template - deprecated in favor of
fast_emission_line- Parameters
- line_umfloat
Line center, microns
- line_fluxfloat
Line normalization
- scale_dispfloat
Factor by which to scale the tabulated resolution FWHM curve
- velocity_sigmafloat
Velocity sigma width in km/s
- nsigint
Number of sigmas of the convolution kernel to sample
- Returns
- resarray-like
Gaussian emission line sampled at the spectrum wavelengths
- fast_emission_line(line_um, line_flux=1, scale_disp=1.0, velocity_sigma=100.0, orders=[1, 2, 3, 4], lorentz=False, verbose=False, **kwargs)[source]
Make an emission line template with numerically correct pixel integration function
- Parameters
- line_umfloat
Line center, microns
- line_fluxfloat
Line normalization
- scale_dispfloat
Factor by which to scale the tabulated resolution FWHM curve
- velocity_sigmafloat
Velocity sigma width in km/s
- orderslist
List of spectral orders to include if the sensitivity curves have been read along with the spectrum.
- lorentzbool
Generate a Lorentzian function instead of a Gaussian
- Returns
- resarray-like
Gaussian emission line sampled at the spectrum wavelengths
- fit_single_template(template, z=0.0, spl=None, spline_type='multiply', lsq=<function lstsq>, lsq_kwargs={'rcond': None}, loss=None, **kwargs)[source]
Resample and fit a template to the spectrum
- Parameters
- template
eazy.templates.Template High-resolution, rest-frame template
- zfloat
Redshift
- spl(N, M) array
Optional spline array
- lsq, lsq_kwargsfunc, dict
Least-squares optimization function, keyword args
- lossfunc
Loss function, e.g,
scip.stats.norm(scale=spec['full_err'][spec.valid])- kwargsdict
keyword arguments passed to
resample_eazy_template, e.g., “scale_disp”, “velocity_sigma”
- template
- Returns
- resultdict
Fit results -
model: best-fit model, (M,) array -A: design matrix, (N, M) array -coeffs: least-squares coefficients, (N,) array -lnp:loss.logpdf(residual)(M,) array
- igm_absorption(z, scale_tau=1.0, scale_disp=1.3)[source]
Inoue+ (2014) IGM absorption
- Parameters
- zfloat
Redshift
- scale_taufloat
Factor to scale $tau_mathrm{IGM}$
- scale_dispfloat
Dispersion R rescaling
- Returns
- igmarray-like
IGM model transmission at observed-frame wavelengths
- initialize_emission_line(nsamp=64)[source]
Initialize emission line
- Parameters
- nsampint
Number of samples for the emission line. Default = 64
- initialize_spec(spec_input, **kwargs)[source]
Read spectrum data from file and initialize attributes
- Parameters
- spec_inputstr
Filename, usually
[root].spec.fits- kwargsdict
Keyword arguments passed to
read_spectrum
- load_sensitivity_curve(sens_file=None, prefix='msaexp_sensitivity', version='001', file_template='{prefix}_{grating}_{filter}_{version}.fits', verbose=False, **kwargs)[source]
- multiplot(sx=10, sy=2.5, z=0, ny=5, xpad=0.05, wave_limits=None, xgrid=None, fig=None, ymax=None, sharey=False, flam=0, okws=None, bkg=0.0, data=None, show_bkg=True, verbose=True, show_sn=False, **kwargs)[source]
Make a plot of the spectrum split into wavelength intervals
- Parameters
- sx, syfloat
x and y size of the separate figure axes
- zfloat
If provided, plot in rest-frame intervals
- nyint
Number of wavelength intervals
- xpadfloat
Fractional overlap of wavelength intervals
- wave_limits[float, float], None
Override limits from min / max wavelength of the spectrum
- xgridlist
Explicit list of wavelength steps. If not provided, will split the spectrum wavelength array into
nyintervals- figfigure
If not provided, initialize a new figure
- Returns
- figfigure
Figure object
- axeslist
List of axis objects
Examples
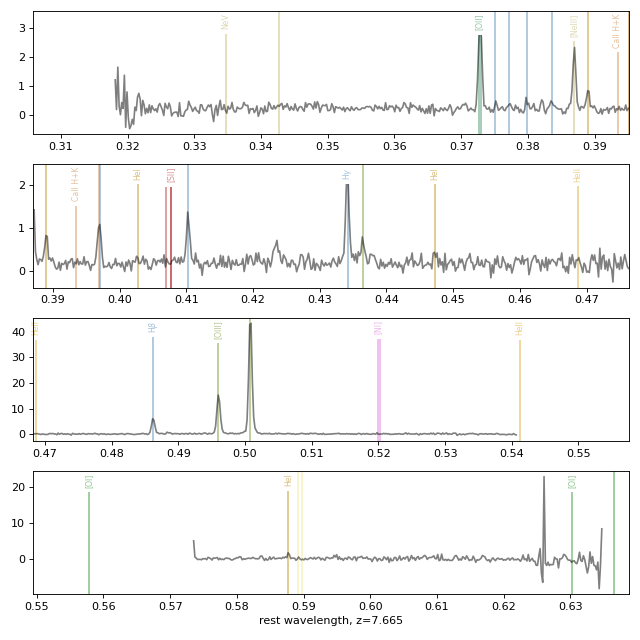
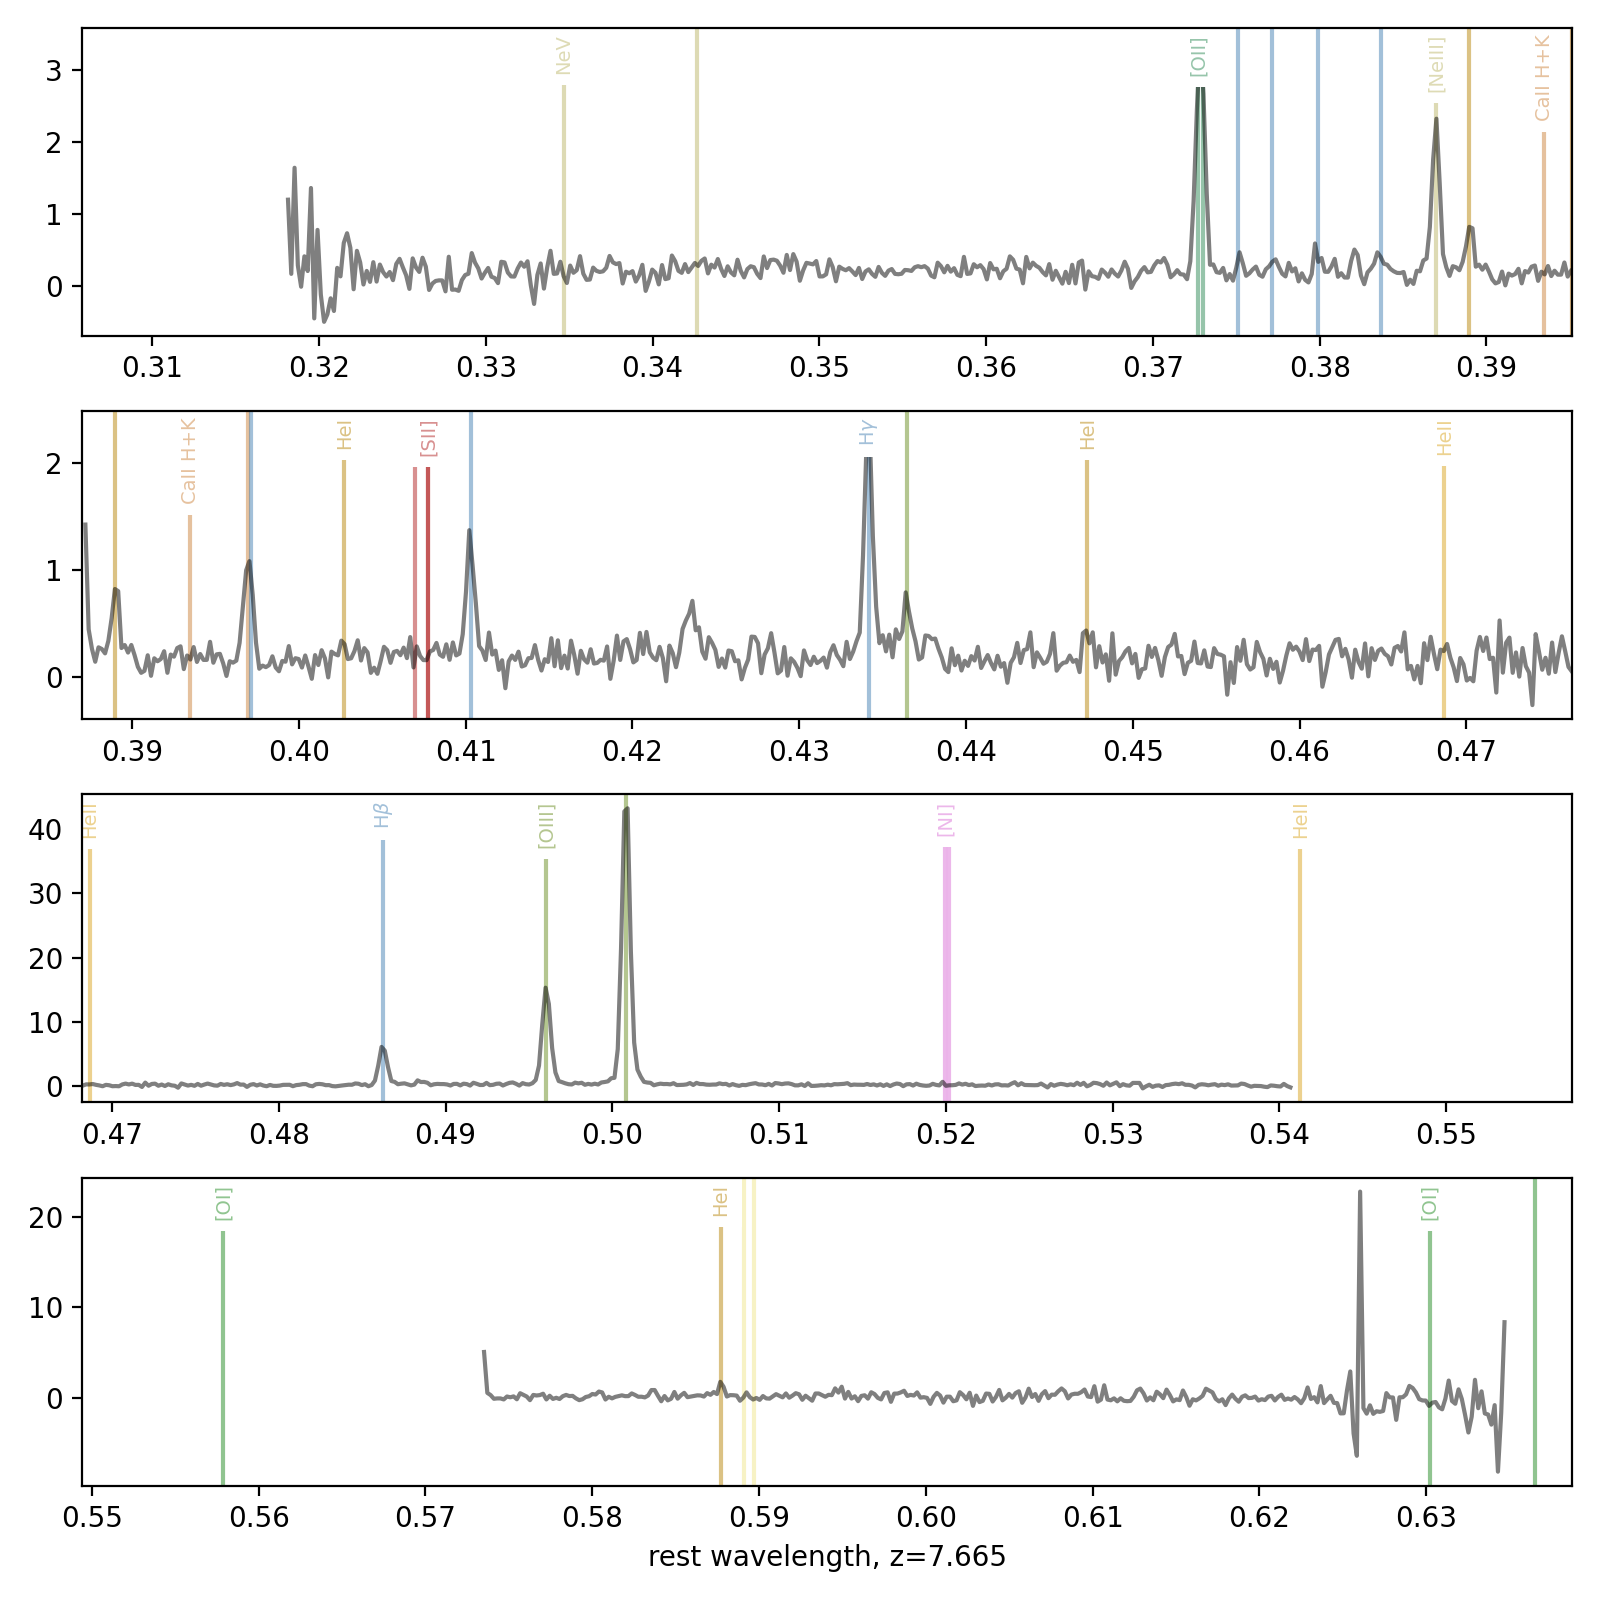
from msaexp import spectrum
import msaexp.utils

sp = spectrum.SpectrumSampler("https://s3.amazonaws.com/msaexp-nirspec/extractions/smacs0723-ero-v4/smacs0723-ero-v4_g395m-f290lp_2736_6355.spec.fits")

z = 7.665

fig, axes = sp.multiplot(
    ny=4,
    sx=8, sy=2,
    z=z,
    color='k', alpha=0.5
)

# Overplot line list
li = msaexp.utils.lines.LineList()
for ax in axes:
    li.add_to_axis(ax, alpha=0.5)

axes[-1].set_xlabel(f'rest wavelength, z={z:.3f}')
fig.tight_layout(pad=1)
(
Source code,png,hires.png,pdf)
- oversampled_wavelengths(factor=5, pad=12)[source]
Generate a wavelength grid that oversamples the spectrum wavelengths
- Parameters
- factorint
Oversampling factor
- Returns
- wavesarray-like
Oversampled wavelengths
- redo_1d_extraction(**kwargs)[source]
Redo 1D extraction from 2D arrays with
make_optimal_extraction- Parameters
- kwargsdict
Keyword arguments passed to
make_optimal_extraction
- Returns
- output
SpectrumSampler A new
SpectrumSamplerobject
- output
Examples
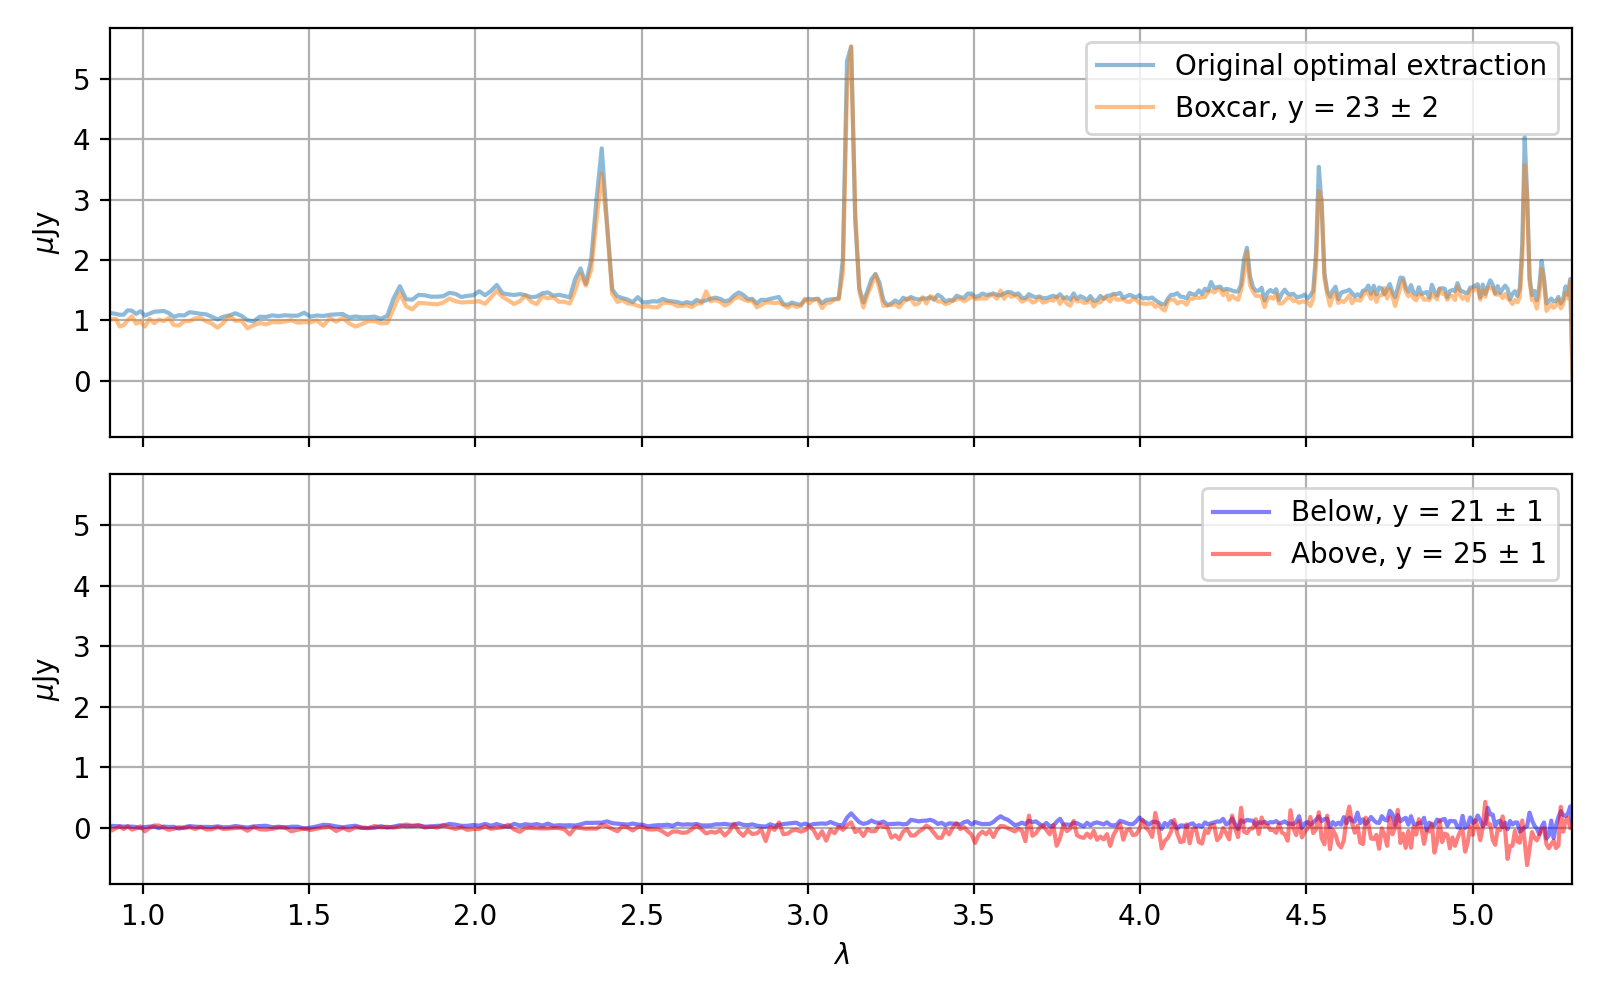
# Compare 1D extractions
from msaexp import spectrum
import matplotlib.pyplot as plt

sp = spectrum.SpectrumSampler('https://s3.amazonaws.com/msaexp-nirspec/extractions/ceers-ddt-v3/ceers-ddt-v3_prism-clear_2750_1598.spec.fits')

fig, axes = plt.subplots(2, 1, figsize=(8, 5),
                         sharex=True, sharey=True)

# Boxcar extraction, center pixel +/- 2 pix
ax = axes[0]
new = sp.redo_1d_extraction(ap_radius=2, bkg_offset=-6)

ax.plot(sp['wave'], sp['flux'], alpha=0.5,
        label='Original optimal extraction')
ax.plot(new['wave'], new['aper_flux'], alpha=0.5,
        label='Boxcar, y = 23 ± 2')

ax.grid()
ax.legend()

# Extractions above and below the center
ax = axes[1]
low = sp.redo_1d_extraction(ap_center=21, ap_radius=1)
hi = sp.redo_1d_extraction(ap_center=25, ap_radius=1)

ax.plot(low['wave'], low['aper_flux']*1.5, alpha=0.5,
        label='Below, y = 21 ± 1', color='b')
ax.plot(hi['wave'], hi['aper_flux']*3, alpha=0.5,
        label='Above, y = 25 ± 1', color='r')

ax.set_xlim(0.9, 5.3)
ax.grid()
ax.legend()

ax.set_xlabel(r'$\lambda$')
for ax in axes:
    ax.set_ylabel(r'$\mu\mathrm{Jy}$')

fig.tight_layout(pad=1)
(
Source code,png,hires.png,pdf)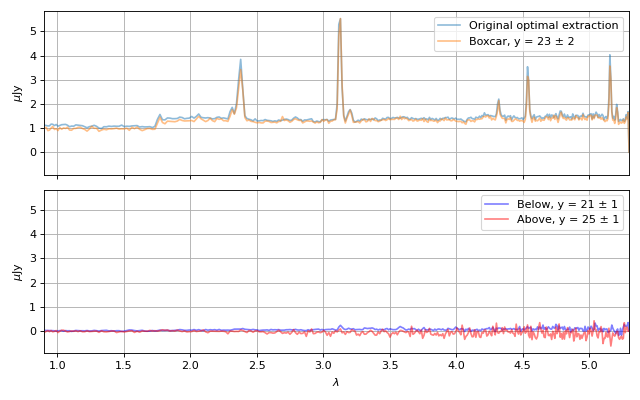
- resample_bagpipes_model(model_galaxy, model_comp=None, nsig=5, scale_disp=1.3, orders=[1, 2, 3, 4], **kwargs)[source]
Resample a
bagpipesmodel to the wavelength grid of the spectrum.See
msaexp.spectrum.resample_bagpipes_model.
- resample_eazy_template(template, z=0, scale_disp=1.0, velocity_sigma=100.0, fnu=True, nsig=4, with_igm=False, orders=[1, 2, 3, 4], verbose=False, **kwargs)[source]
Smooth and resample an
eazy.templates.Templateobject onto the observed wavelength grid of a spectrum- Parameters
- template
eazy.templates.Template Template object
- zfloat
Redshift
- scale_dispfloat
Factor multiplied to the tabulated spectral resolution before sampling
- velocity_sigmafloat
Gaussian velocity broadening factor, km/s
- fnubool
Return resampled template in f-nu flux densities
- nsigint
Number of standard deviations to sample for the convolution
- orderslist
List of spectral orders to include if the sensitivity curves have been read along with the spectrum.
- template
- Returns
- resarray-like
Template flux density smoothed and resampled at the spectrum wavelengths