LineList
- class msaexp.utils.LineList(data=None)[source]
Bases:
objectTools for working with a table of lines
Examples
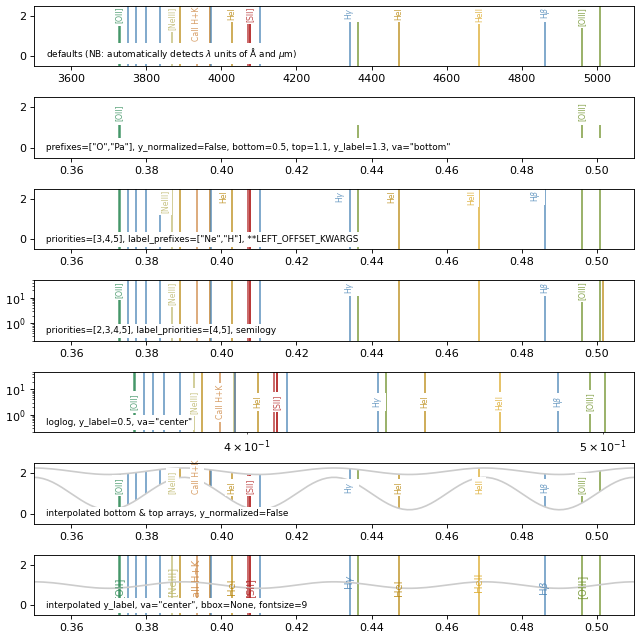
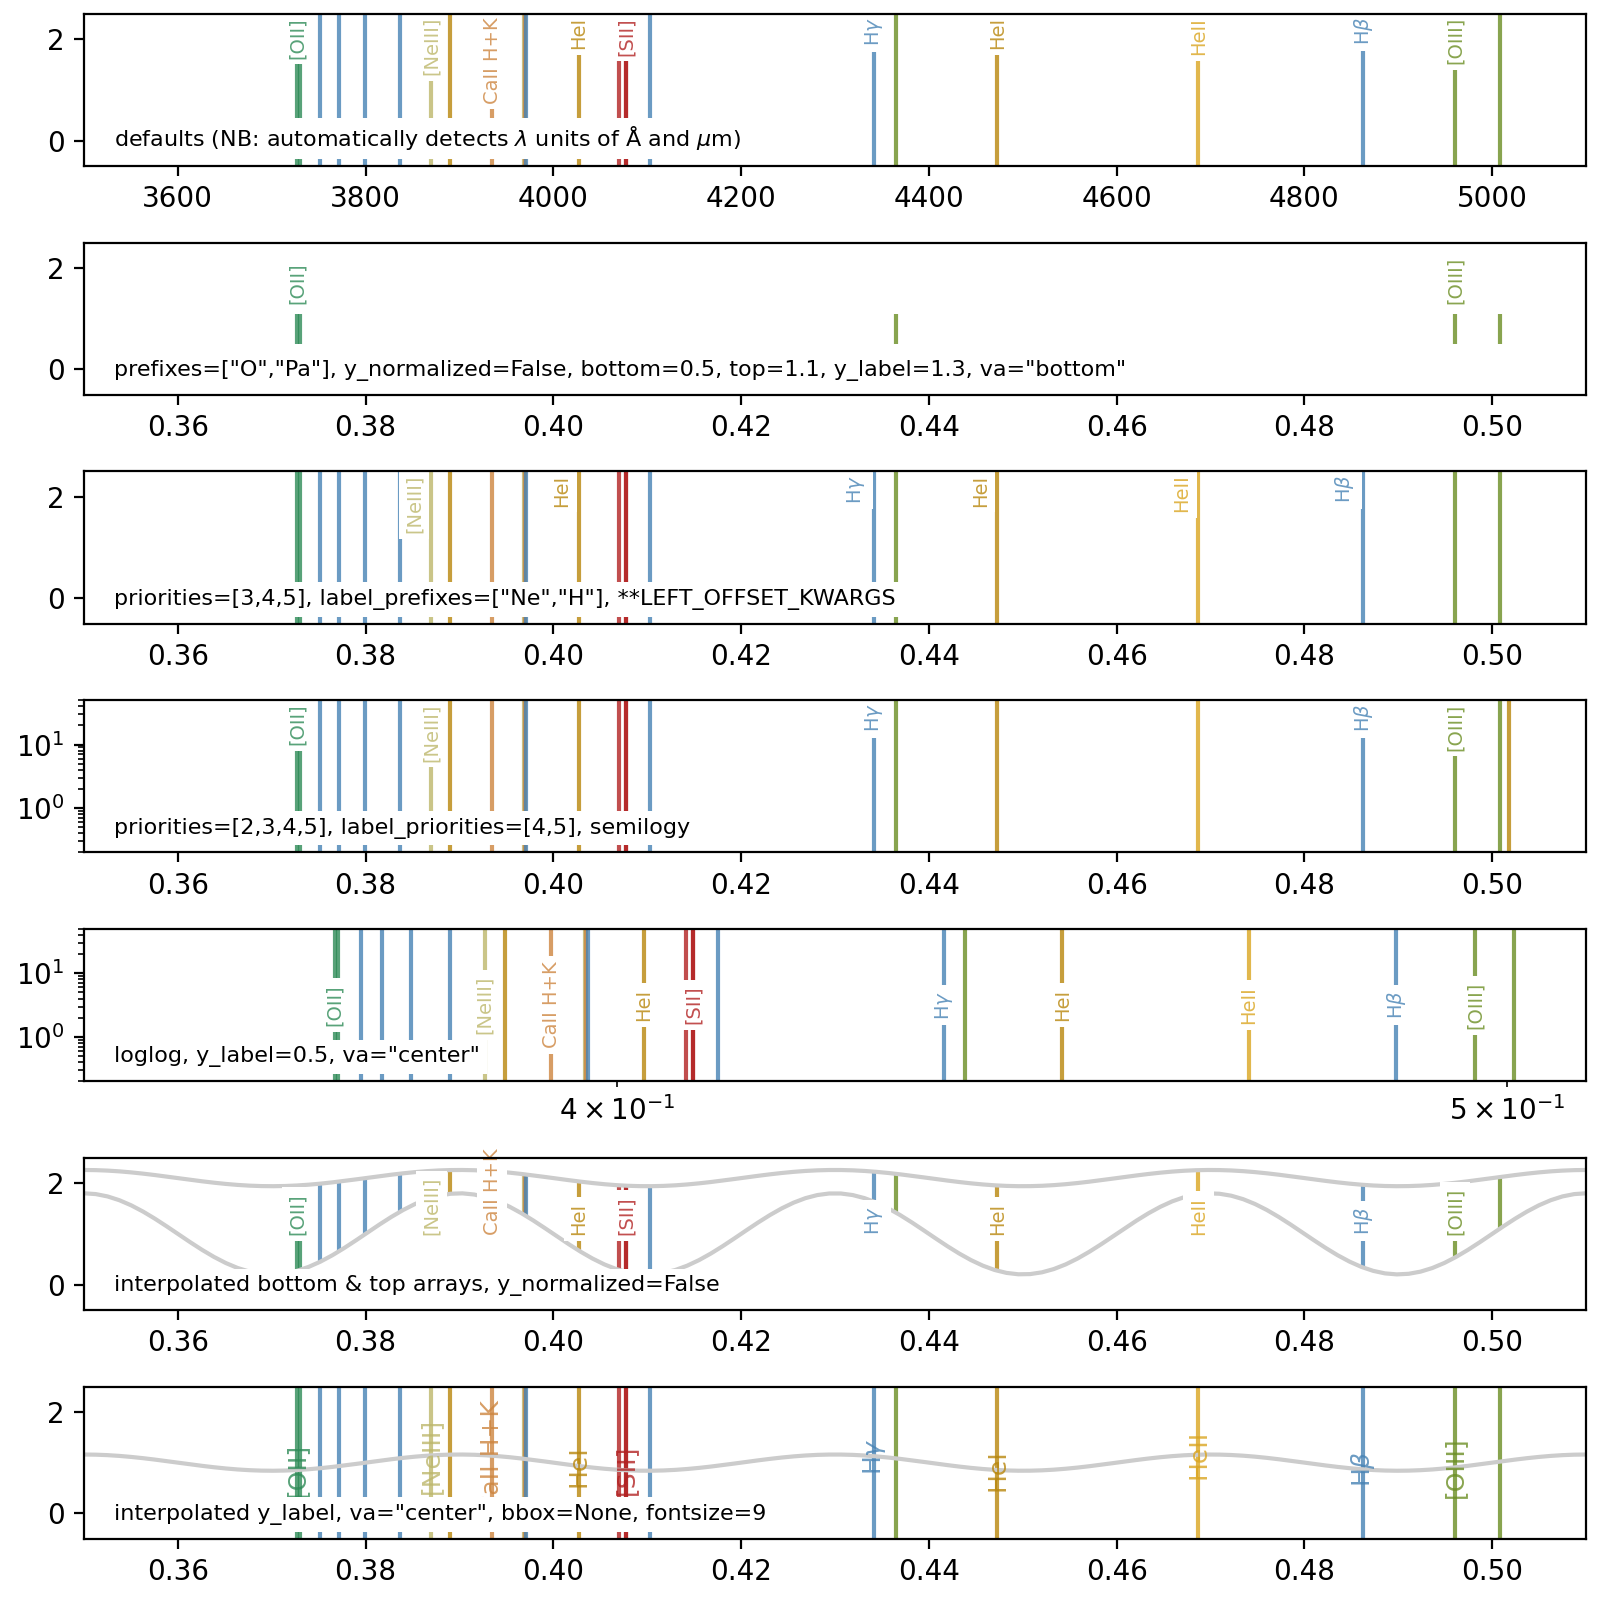
from msaexp.utils import LineList

ll = LineList()
fig = ll.demo()
(
Source code,png,hires.png,pdf)
Attributes Summary
Methods Summary
add_to_axis(ax[, wave_pixels, bottom, top, ...])Add vlines and labels to axis
append_scaled_orders([priorities, orders, ...])Add rows to the
datatable for higher spectral orders where wavelength multiplied by $m=2,3,...$demo([xlim, figsize])Show a demonstration of various plot options
from_table(tab[, wave_column, to_angstroms, ...])Generate from normal table with a list of line wavelengths
Insert extra spaces in ion names
load_data([fill_color])Load the data from
msaexp/data/linelist.ecsvselect_lines([z, wave_range, prefixes, ...])Get selection of lines within a wavelength range
spec_model(spec[, z, selected, fnu, use_ratios])Make line models
msaexp.spectrum.SpectrumSampler.fast_emission_lineAttributes Documentation
- CLEAN_CENTER_KWARGS = {'bbox': {'alpha': 1.0, 'boxstyle': 'square,pad=0.3', 'ec': 'None', 'fc': 'w'}, 'ha': 'center', 'x_pad': 0.0}
- LEFT_OFFSET_KWARGS = {'ha': 'right', 'x_pad': -0.005}
- N
- RIGHT_OFFSET_KWARGS = {'ha': 'left', 'x_pad': 0.005}
- WHITE_BBOX = {'alpha': 1.0, 'boxstyle': 'square,pad=0.3', 'ec': 'None', 'fc': 'w'}
Methods Documentation
- add_to_axis(ax, wave_pixels=None, bottom=0, top=1.0, x_pad=0, wfunc=<function min>, y_label=0.98, priorities=[3, 4, 5], label_priorities=None, label_prefixes=[], y_normalized=True, rotation=90, ha='center', va='top', lw=1.5, ls='-', fontsize=7, alpha=0.8, label_alpha=None, bbox={'alpha': 1.0, 'boxstyle': 'square,pad=0.3', 'ec': 'None', 'fc': 'w'}, zorder=1, label_zorder=None, **kwargs)[source]
Add vlines and labels to axis
- Parameters
- ax
matplotlibaxis Axis to draw labels in
- bottomfloat, (array-like, array-like)
Lower limit of vlines to draw. If two arrays are provided, will interpolate the value
value = np.interp(wave, *bottom)- topfloat, (array-like, array-like)
Upper limit of the vlines, with same interpolation options as
bottom- x_padfloat
relative padding for text labels
- wfuncfunc
Function to apply to the potential multiple entries for line complexes to specify where to draw the labels
- y_labelfloat
Vertical location of the line text labels
- prioritieslist
List of priorities to include from the linelist table
- label_prioritieslist, None
List of priorities to include with text labels. If not provided, will be the same as
priorities- label_prefixeslist
Prefix filtering for lines with text labels
- y_normalizedbool
If True, the
bottom,topandy_labelvalues are calculated in the normalized frame of the plot extent, i.e., with 0 at the bottom and 1 at the top. Not used if values are interpolated.- lw, lsfloat, string
Linewidth and linestyle properties for the vlines
- rotation, ha, va, fontsize, alpha, bbox, zorder
Text label properties
- ax
- Returns
- datatable
View of the linelist table with the selected lines
- append_scaled_orders(priorities=[5], orders=[2, 3], priority_offset=100, append=True)[source]
Add rows to the
datatable for higher spectral orders where wavelength multiplied by $m=2,3,…$- Parameters
- prioritieslist, None
List of priorities to include
- orderslist
List of order integers
- priority_offsetfloat
New rows will have priority + priority_offset
- appendbool
Append new rows directly to the
dataattribute table
- Returns
- order_rowstable
Table with wavelengths scaled by the requested orders and updated labels
- static from_table(tab, wave_column='wavelength', to_angstroms=1.0, color='0.5', priority=5, prefix='', ratio_column=None)[source]
Generate from normal table with a list of line wavelengths
- select_lines(z=0, wave_range=[0, inf], prefixes=[], exclude_prefixes=[], priorities=[4, 5], floor=True, max_microns=500, **kwargs)[source]
Get selection of lines within a wavelength range
- Parameters
- zfloat
Redshift
- wave_range[float, float]
Observed-frame wavelength range. The script tries to automatically distinguish between wavelength units of Angstroms or microns assuming the latter if
wave_range[1] < 500- prefixeslist
List of strings compared to the
namecolumn in the linelist using the testname.startswith(prefix)- prioritieslist
List of linelist priorities to include
- floorbool
If true, ignore decimal part of the linelist priorities and just compare the integer values
- max_micronsfloat
Threshold compared to
max(x)above which wavelengths are interpreted to be $mathrm{AA}$ rather than $mumathrm{m}$- Returns
- ——-
- selectedboolean array
Selection array on the listlist table that satisfy the selection criteria
- x_scalefloat
Scale factor needed to put the “wavelength” column of the linelist in the frame of
wave_range
- spec_model(spec, z=0, selected=None, fnu=True, use_ratios=True, **kwargs)[source]
Make line models
msaexp.spectrum.SpectrumSampler.fast_emission_line- Parameters
- spec
SpectrumSampler Spectrum object
- zfloat
Redshift
- selectedNone, array
Line selection array. If not provided, will pull from
LineList.select_lines.- fnubool
Return in fnu units
- use_ratiosbool
Use line ratio values. If False, normalize line flux to unity.
- kwargsdict
Keyword arguments passed to
LineList.select_linesandmsaexp.spectrum.SpectrumSampler.fast_emission_line
- spec
- Returns
- resultdict
Model results:
templates:(Nline, Nwave)array. of line templatesnames: line namesindex: indices of the selected lines from the full linelist