get_normalization_correction
- msaexp.utils.get_normalization_correction(wavelengths, quadrant, xcen, ycen, grating='PRISM', **kwargs)[source]
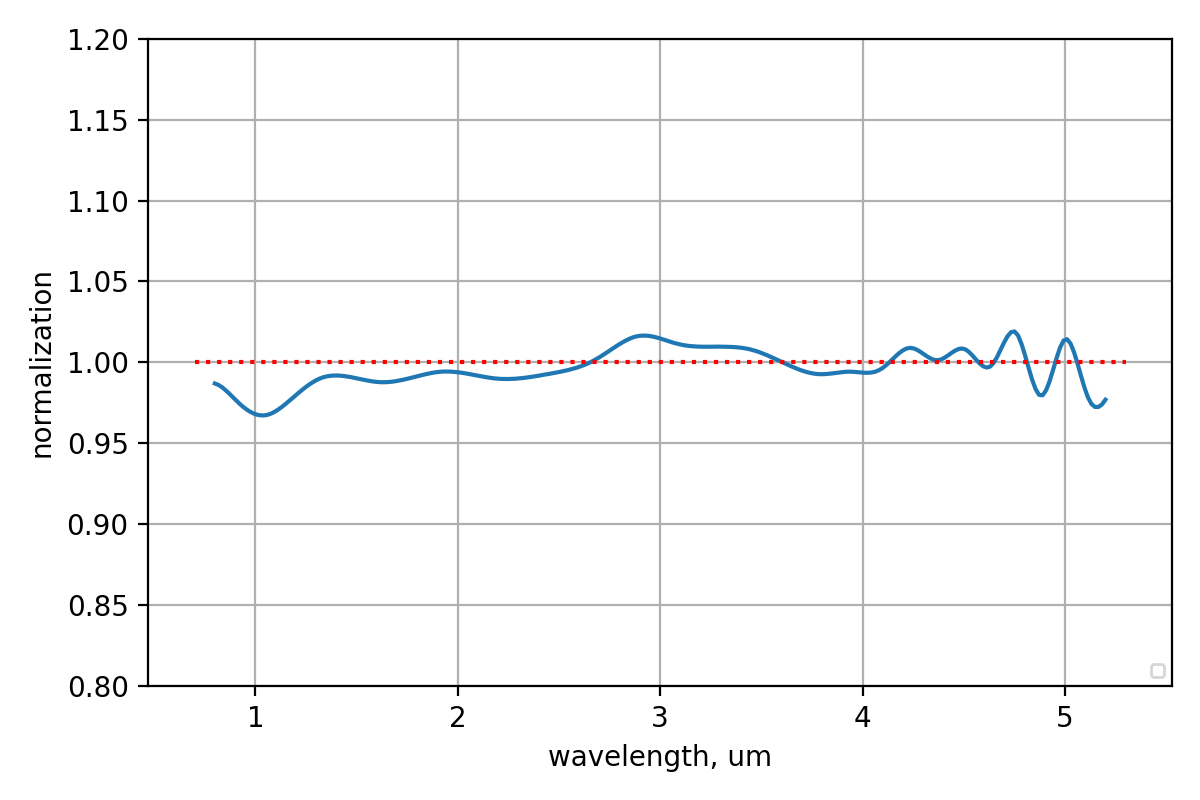
Normalization correction derived from empty sky slits, analagous to a correction to the SFLAT calibration
- Parameters
- wavelengthsarray-like
Sample wavelengths
- quadrant[1,2,3,4]
MSA quadrant
- xcenint
MSA column, 1-365
- ycenint
MSA row, 1-171
- gratingstr
Grating name (just
'PRISM'implemented so far)
- Returns
- corrarray-like
Correction to apply to slit data, i.e.,
corrected = slit.data * corr
Examples
import numpy as np
import matplotlib.pyplot as plt
from msaexp.utils import get_normalization_correction

waves = np.linspace(0.8, 5.2, 256)

fig, ax = plt.subplots(1, 1, figsize=(6,4))

corr = get_normalization_correction(waves, 1, 180, 85, grating="PRISM")
ax.plot(waves, corr)

ax.legend(loc='lower right', fontsize=6)
ax.grid()
ax.set_ylim(0.8, 1.2)
ax.hlines([1.], 0.7, 5.3, color='r', linestyle=':')

ax.set_xlabel('wavelength, um')
ax.set_ylabel('normalization')

fig.tight_layout(pad=1)
fig.show()
(
Source code,png,hires.png,pdf)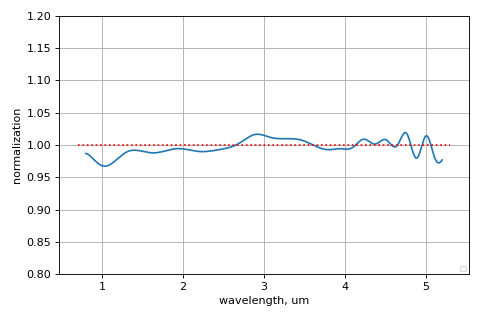