get_prism_wave_bar_correction
- msaexp.utils.get_prism_wave_bar_correction(scaled_yshutter, wavelengths, num_shutters=3, wrap='auto', wrap_pad=0.2, mask=True, bar_data=None)[source]
Generate the
msaexpprism bar-shadow correction including wavelength dependence- Parameters
- scaled_yshutterarray-like
Cross-dispersion pixel coordinates, scaled by a factor of 1/5 to roughly have units of the MSA shutters
- wavelengthsarray-like
Wavelength of the pixel samples, microns
- num_shutters[1,2,3]
Number of shutters in the slitlet
- wrapbool, str
If
auto, determine if the bounds ofscaled_yshutterare more than 0.5 shutters outside of the (-1.5, 1.5) range used to determine the correction. If so, or ifwrap=True, replicate the center shutter to all specified shutters.- wrap_padfloat
If
wrap, pad the outer edges that are unilluminated and won’t be properly calibrated- maskbool
Apply mask where the bar correction is within the shutter pixels of the calibration
- bar_dataNone, dict
Correction data. If not specified, read from
prism_{num_shutters}_bar_coeffs_wave.yaml
- Returns
- bararray-like
The estimated bar throughput. To correct, divide by
bar- is_wrappedbool
Was the bar profile wrapped using the single central shutter, e.g., from
wrap='auto'?
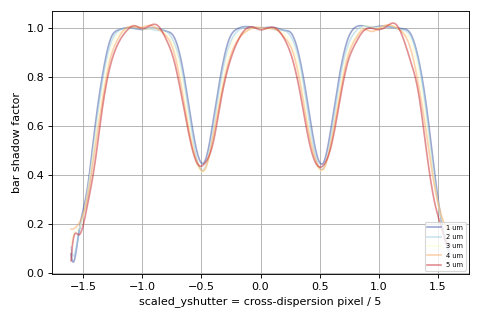
import numpy as np
import matplotlib.pyplot as plt
from msaexp.utils import get_prism_wave_bar_correction

scaled_yshutter = np.linspace(-1.6, 1.6, 512)

fig, ax = plt.subplots(1,1,figsize=(6,4))

for w in [1.0, 2.0, 3.0, 4.0, 5.0]:
    bar, _wrapped = get_prism_wave_bar_correction(
                            scaled_yshutter,
                            np.full_like(scaled_yshutter, w),
                            num_shutters=3,
                            wrap=False)

    ax.plot(scaled_yshutter, bar,
            label=f'{w:.0f} um',
            alpha=0.5,
            color=plt.cm.RdYlBu_r(np.interp(w, [0.8, 5.3], [0, 1]))
            )

ax.legend(loc='lower right', fontsize=6)
ax.grid()

ax.set_xlabel('scaled_yshutter = cross-dispersion pixel / 5')
ax.set_ylabel('bar shadow factor')

fig.tight_layout(pad=1)
fig.show()
(
Source code,png,hires.png,pdf)