MSAMetafile
- class msaexp.msa.MSAMetafile(filename)[source]
Bases:
objectHelper for parsing MSAMETFL metadata files
- Parameters
- filenamestr
Filename of an
_msa.fitsmetadata file or a FITS file with a keywordMSAMETFLin the primary header, e.g., a_rate.fitsfile.
Examples
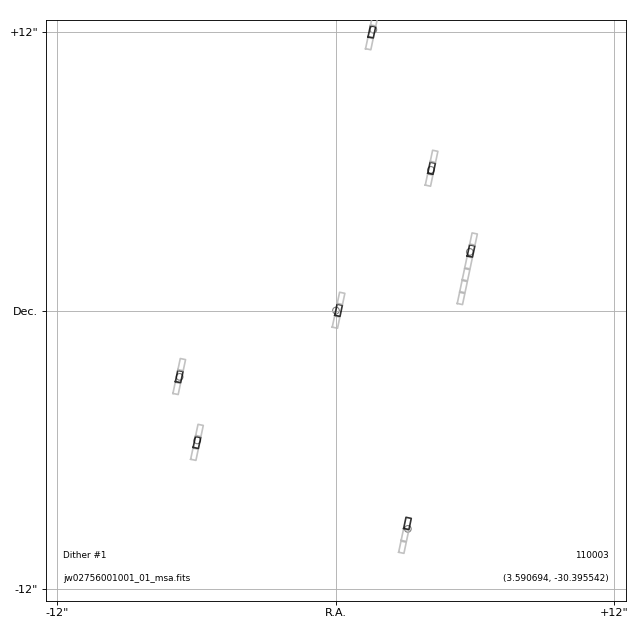
### Make a plot with slitlets

import numpy as np
import matplotlib.pyplot as plt
from msaexp import msa

uri = 'https://mast.stsci.edu/api/v0.1/Download/file?uri=mast:JWST/product/'
meta = msa.MSAMetafile(uri+'jw02756001001_01_msa.fits')

fig, axes = plt.subplots(1, 3, figsize=(9, 2.6),
                         sharex=True, sharey=True)
cosd = np.cos(np.median(meta.src_table['dec'])/180*np.pi)

# Show offset slitlets from three dithered exposures
for i in [0,1,2]:
    ax = axes[i]
    ax.scatter(meta.src_table['ra'], meta.src_table['dec'],
               marker='.', color='k', alpha=0.5)
    slits = meta.regions_from_metafile(dither_point_index=i+1,
                                       as_string=False,
                                       with_bars=True)
    for s in slits:
        if s.meta['is_source']:
            if s.meta['source_id'] in [110003, 410044, 410045]:
                ax.text(s.meta['ra'] - 0.8/3600, s.meta['dec'],
                        s.meta['source_id'],
                        fontsize=7, ha='left', va='center')
            fc = '0.5'
        else:
            fc = 'pink'

        for patch in s.get_patch(fc=fc, ec='None', alpha=0.8,
                                 zorder=100):
            ax.add_patch(patch)

    ax.set_aspect(1./cosd)
    ax.set_xlim(3.5936537138517317, 3.588363444812261)
    ax.set_ylim(-30.39750646306242, -30.394291511397544)

    ax.grid()
    ax.set_title(f'Dither point #{i+1}')

x0 = np.mean(ax.get_xlim())
ax.set_xticks(np.array([-5, 0, 5])/3600./cosd + x0)
ax.set_xticklabels(['+5"', 'R.A.', '-5"'])

y0 = np.mean(ax.get_ylim())
ax.set_yticks(np.array([-5, 0, 5])/3600. + y0)
axes[0].set_yticklabels(['-5"', 'Dec.', '+5"'])
axes[1].scatter(x0, y0, marker='x', c='b')
axes[1].text(0.5, 0.45, f'({x0:.6f}, {y0:.6f})',
             ha='left', va='top',
             transform=axes[1].transAxes, fontsize=6,
             color='b')

fig.tight_layout(pad=0.5)
(
Source code,png,hires.png,pdf)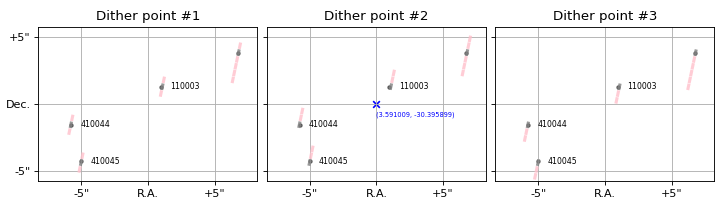
- Attributes
- filenamestr
Input filename
- metafilestr
Filename of the MSAMETFL, either
filenameitself or derived from it- shutter_table
Table Table of shutter metadata
- src_table
Table Table of source information
- mast
Table, None Result of
query_mast_exposures
Attributes Summary
List of unique
msa_metadata_id, dither_point_indexpairs from theshutter_tableList of unique
msametid, exposurepairs from themastmetadata table- Returns
- Returns
Methods Summary
all_regions_from_metafile_siaf(**kwargs)Run
regions_from_metafile_siaffor all exposuresfit_mast_pointing_offset([iterations, ...])Fit for offsets to the pointing attitude derived from the MAST metadata
get_exposure_info([msa_metadata_id, ...])Get MAST keywords for a particular exposure
get_siaf_aperture([msa_metadata_id, ...])Generate a
pysiafaperture object based on pointing informationget_siaf_transforms([prefix, check_rms])Read shutter (i,j) > (v2,v3) transformations from the files at https://github.com/spacetelescope/pysiaf/tree/master/pysiaf/source_data/NIRSpec/delivery/test_data/apertures_testData
get_transforms([dither_point_index, ...])Fit for
Polynomial2Dtransforms between slit(row, col)and(ra, dec).make_summary_table([msa_metadata_id, ...])Make a summary table for all sources in the mask
merge_source_ids([sort_count, verbose])Merge cases where a particular slitlet_id has multiple source_ids
plot_slitlet([source_id, ...])Make a plot showing a slitlet
query_mast_exposures([force])Query MAST database for exposures for this MSA file
regions_from_metafile([as_string, with_bars])Get slit footprints in sky coords
regions_from_metafile_siaf([as_string, ...])MSA shutter regions using pointing info and SIAF shutter transformations
write([prefix, overwrite, verbose])Write a new metadata file
Attributes Documentation
- key_pairs
List of unique
msa_metadata_id, dither_point_indexpairs from theshutter_table- Returns
- keyslist
List of key pairs
- mast_key_pairs
List of unique
msametid, exposurepairs from themastmetadata table- Returns
- keyslist
List of key pairs
- metadata_id_list
- Returns
- idslist
list of metadata_id from
shutter_table
- metadata_id_unique
- Returns
- un
grizli.utils.Unique Unique of metadata_id from
shutter_table
- un
- query_product_level = ['2b']
Methods Documentation
- all_regions_from_metafile_siaf(**kwargs)[source]
Run
regions_from_metafile_siaffor all exposures- Parameters
- kwargsdict
Passed to
regions_from_metafile_siaf
- Returns
- outputlist, str
Depending on
as_stringinput keyword
- fit_mast_pointing_offset(iterations=3, with_ransac=True, verbose=True, apply=True, init_ref_columns=False, **kwargs)[source]
Fit for offsets to the pointing attitude derived from the MAST metadata
- Parameters
- iterationsint
Number of fitting iterations
- with_ransacbool
Refine transformation with
skimage.measureinliers- verbosebool
Print messages
- applybool
Add updated pointing parameters to
refcolumns inmastmetadata- init_ref_columnsbool
Initialize using “ref” columns in the MAST table
- Returns
- res
Table Table summarizing fit results
- res
- get_exposure_info(msa_metadata_id=1, dither_point_index=1, **kwargs)[source]
Get MAST keywords for a particular exposure
- Parameters
- msa_metadata_id, dither_point_indexint
Exposure definition
- Returns
- row
Row Row of the
mastinfo table for a particular exposure
- row
- get_siaf_aperture(msa_metadata_id=1, dither_point_index=1, pa_offset=-0.1124, ra_ref=None, dec_ref=None, roll_ref=None, use_ref_columns=True, apername='NRS_FULL_MSA', **kwargs)[source]
Generate a
pysiafaperture object based on pointing information- Parameters
- msa_metadata_id, dither_point_indexint
Exposure definition
- pa_offsetfloat
Empirical offset added to
gs_v3_pafrom the MAST query to matchROLL_REFin the science headers- ra_ref, dec_ref, roll_refNone, float
Specify a reference parameters aperture attitude, e.g., taken from the
ROLL_REFscience header keywords- use_ref_columnsbool
Use “ref” columns in
mastmetadata table if found, e.g., generated fromfit_mast_pointing_offset
- Returns
- ra, dec, rollfloat
The V2/V3 reference ra, dec, roll used for the aperture attitude
- ap
pysiaf.aperture.NirspecAperture Aperture object with attitude set based on database pointing keywords and with various coordinate transformation methods
- get_siaf_transforms(prefix='https://github.com/spacetelescope/pysiaf/raw/master/pysiaf/source_data/NIRSpec/delivery/test_data/apertures_testData/', check_rms=True)[source]
Read shutter (i,j) > (v2,v3) transformations from the files at https://github.com/spacetelescope/pysiaf/tree/master/pysiaf/source_data/NIRSpec/delivery/test_data/apertures_testData
- Parameters
- prefixstr, optional
URL prefix for the files containing the transformations.
- check_rmsbool, optional
If True, calculate and print the root mean square (RMS) of the transformations.
- Returns
- transformsdict
A dictionary containing the (i,j) > (v2,v3) transformations for each quadrant of the MSA.
- get_transforms(dither_point_index=None, msa_metadata_id=None, fit_degree=2, verbose=False, **kwargs)[source]
Fit for
Polynomial2Dtransforms between slit(row, col)and(ra, dec).- Parameters
- dither_point_indexint, None
Dither index in
shutter_table- msa_metadata_idint, None
Metadata id in
shutter_table- fit_degreeint
Polynomial degree
- verbosebool
Print status messages
- Returns
- dither_matchbool array
Boolean mask of
shutter_tablematchingdither_point_index- meta_matchbool array
Boolean mask of
shutter_tablematchingmsa_metadata_id- coeffsdict
Polynomial2Dtransformations to sky coordinates in each of 4 MSA quadrants>>> quadrant = 1 >>> pra, pdec = coeffs[quadrant] >>> ra = pra(shutter_row, shutter_column) >>> dec = pdec(shutter_row, shutter_column)
- inv_coeffsdict
Inverse
Polynomial2Dtransformations from sky to shutters:>>> quadrant = 1 >>> prow, pcol = inv_coeffs[quadrant] >>> shutter_row = prow(ra, dec) >>> shutter_column = pcol(ra, dec)
- make_summary_table(msa_metadata_id=None, image_path='slit_images', write_tables=True, **kwargs)[source]
Make a summary table for all sources in the mask
- Parameters
- msa_metadata_idint, None
Metadata id in
shutter_table- image_pathstr
Path for slitlet thumbnail images with filename derived from
self.metafile.- write_tablesbool
Write FITS and HTML versions of the summary table
- kwargsdict
Arguments passed to
plot_slitletifimage_pathspecified
- Returns
- tab
Table Summary table with slit information.
- tab
Examples
>>> from msaexp import msa
>>> uri = 'https://mast.stsci.edu/api/v0.1/Download/file?uri=mast:JWST/product/'
>>> meta = msa.MSAMetafile(uri+'jw02756001001_01_msa.fits')
>>> res = meta.make_summary_table(msa_metadata_id=None,
                                  image_path=None,
                                  write_tables=False)
>>> print(res[-10:])
source_id    ra       dec     nexp Exp1 Exp2 Exp3
--------- -------- ---------- ---- ---- ---- ----
   320023 3.610363 -30.414991    3  -o-  o--  --o
   320029 3.557964 -30.426137    3  -o-  o--  --o
   320035 3.616975 -30.419344    3  -o-  o--  --o
   340975 3.576616 -30.401801    3  ---  ---  ---
   410005 3.604646 -30.392461    3  ---  ---  ---
   410044 3.592863 -30.396336    3  -o-  o--  --o
   410045 3.592619 -30.397096    3  -o-  o--  --o
   410067 3.571049 -30.388132    3  -o-  o--  --o
   500002 3.589697 -30.398156    2  --o  -o-
   500003 3.591399 -30.401982    3  -o-  o--  --o
- merge_source_ids(sort_count=-1, verbose=True, **kwargs)[source]
Merge cases where a particular slitlet_id has multiple source_ids
- Parameters
- sort_countint
Direction in which to prefer among the multiple
source_idvalues sorted by their count.
- Returns
shutter_tableattribute updated in place
- plot_slitlet(source_id=110003, dither_point_index=1, msa_metadata_id=None, cutout_size=1.5, step=None, rgb_filters=None, rgb_scale=5, rgb_invert=False, figsize=(4, 4), ax=None, add_labels=True, set_axis_labels=True)[source]
Make a plot showing a slitlet
- Parameters
- source_idint
Source id, must be in
src_table- dither_point_indexint
Dither to show
- msa_metadata_idint
Optional specified
msa_metadata_idinshutter_table- cutout_sizefloat
Cutout half-width, arcsec
- stepint
Place to mark axis labels, defaults to
floor(cutout_size)- rgb_filterslist, None
List of filters to use for an RGB cutout. Will be grayscale if just one item specified.
- rgb_scalefloat
Scaling of the image thumbnail if
rgb_filtersspecified- rgb_invertbool
Invert color map if
rgb_filtersspecified- figsizetuple
Size if generating a new figure
- ax
AxesSubplot, None Plot axis
- add_labelsbool
Add plot labels
- set_axis_labelsbool
Set axis labels
- Returns
- fig
matplotlib.figure.Figure Figure object if generating a new figure, None otherwise
- ax
AxesSubplot Plot axes
- fig
Examples
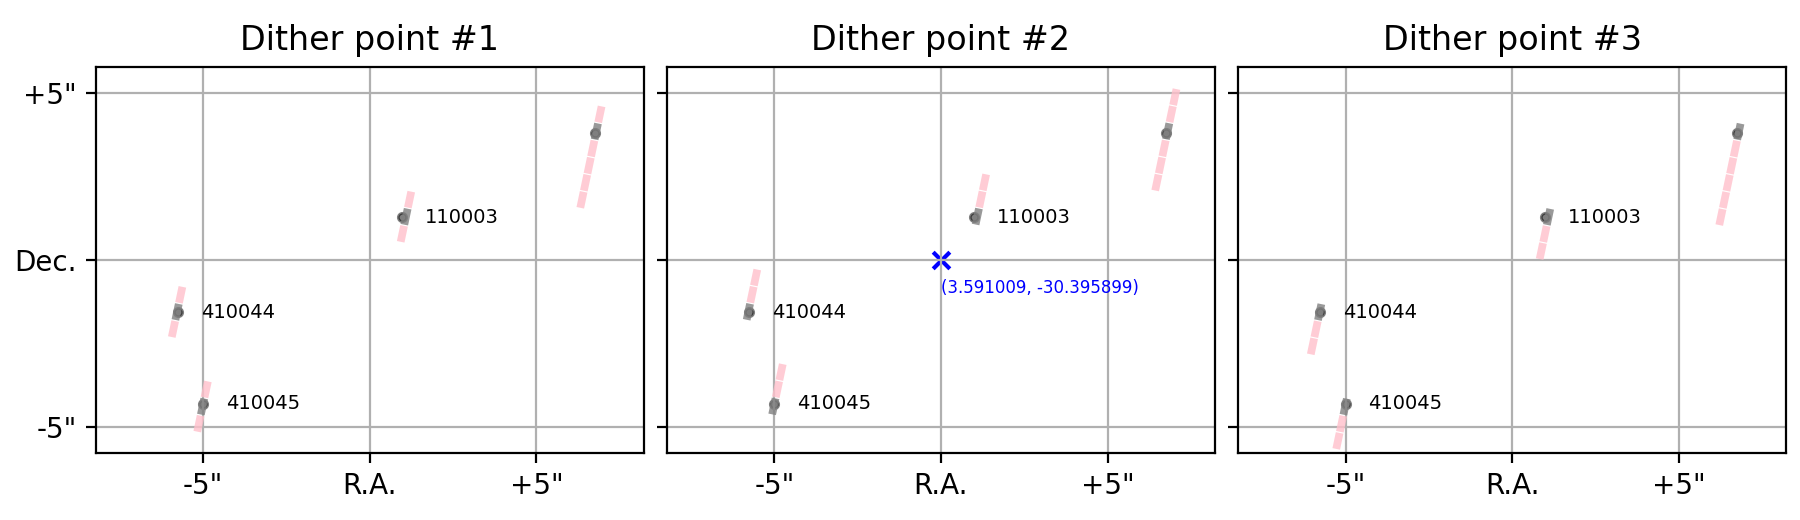
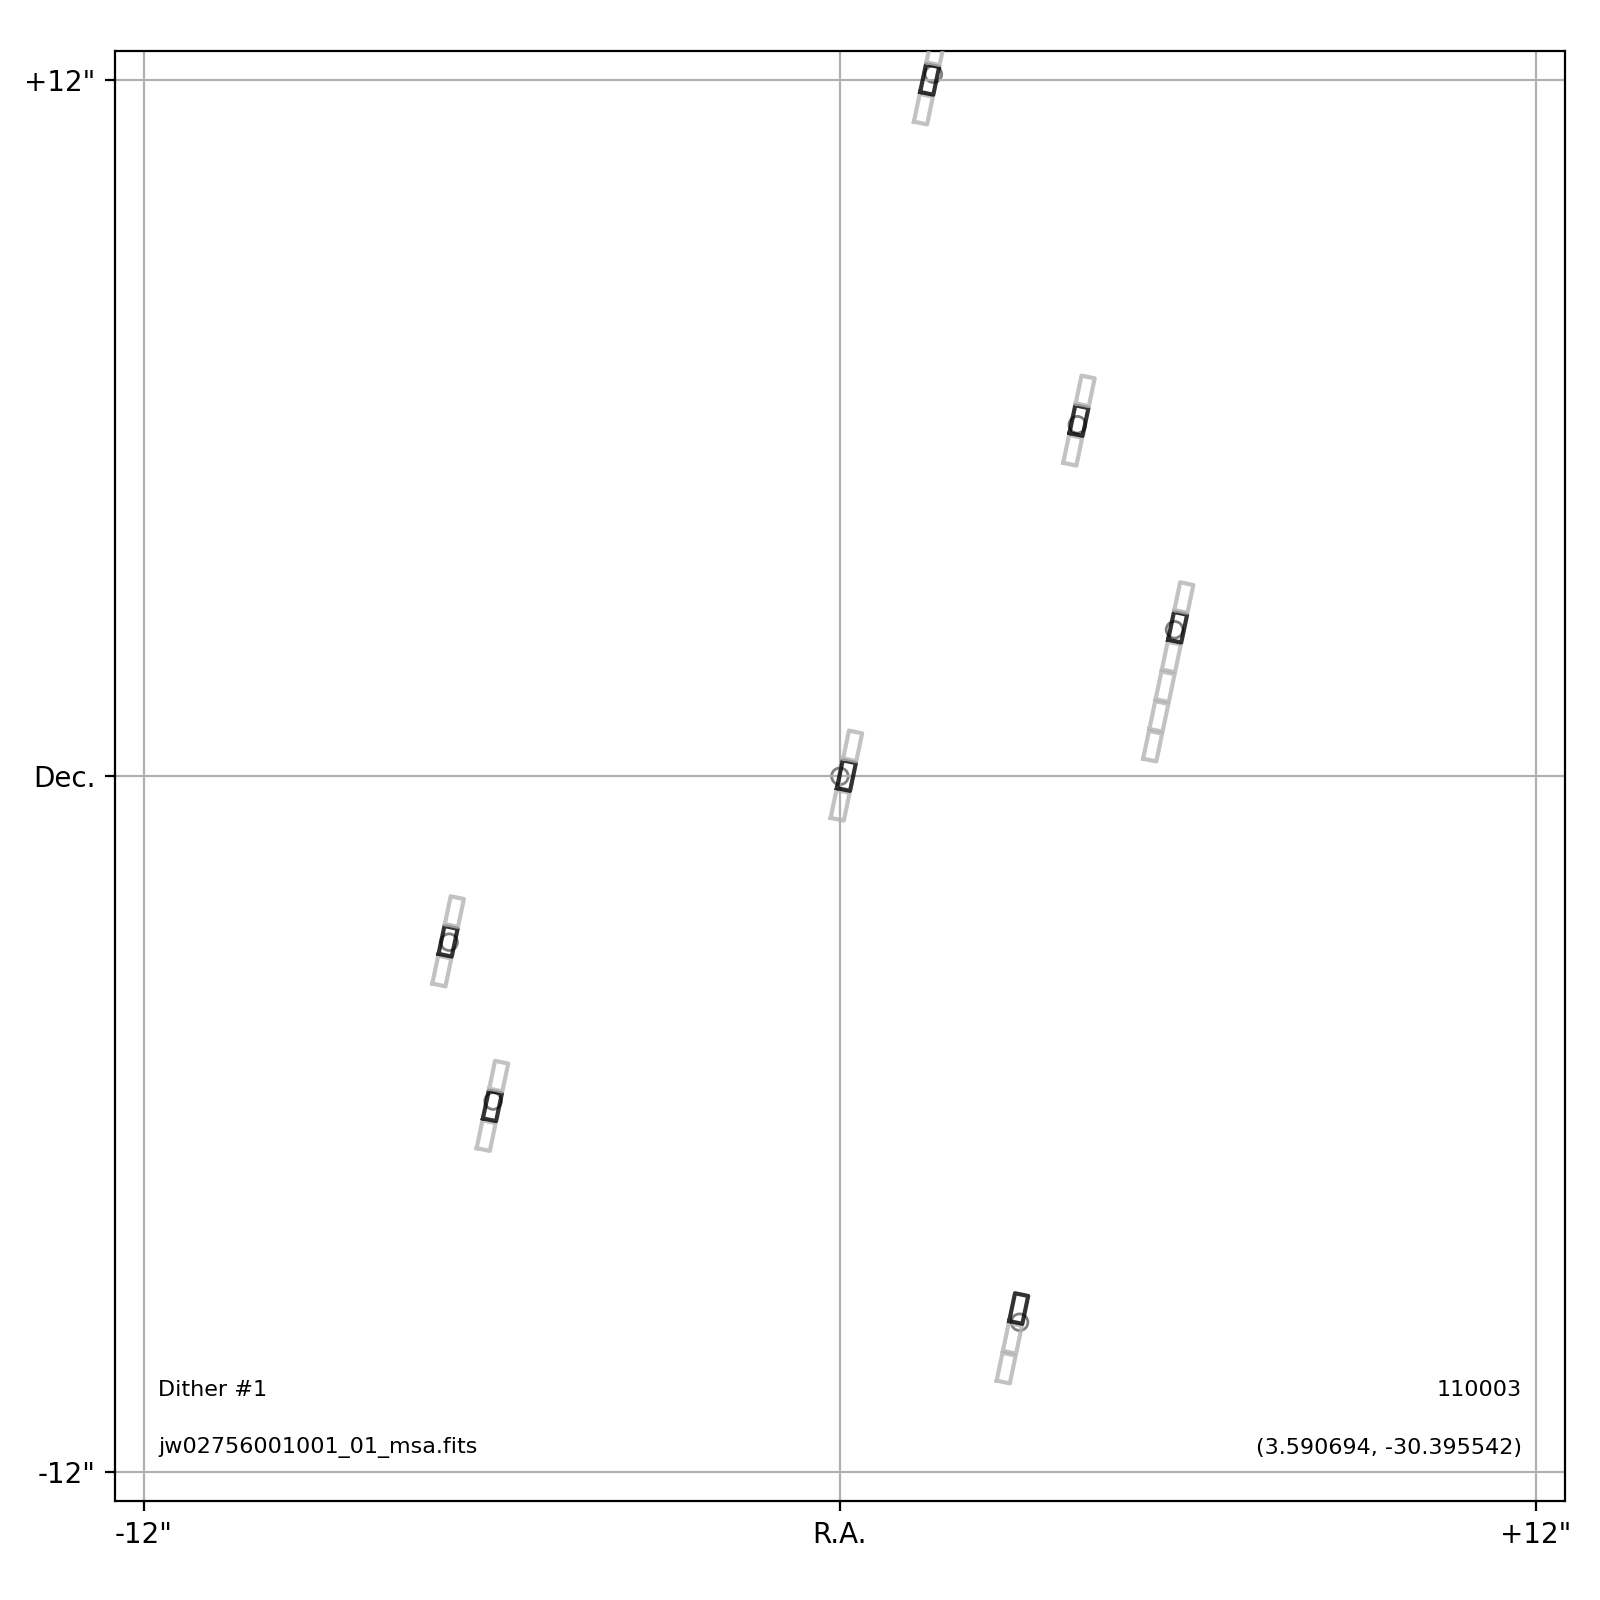
# Simple figure

import matplotlib.pyplot as plt
from msaexp import msa

uri = 'https://mast.stsci.edu/api/v0.1/Download/file?uri=mast:JWST/product/'
meta = msa.MSAMetafile(uri+'jw02756001001_01_msa.fits')

fig, ax = plt.subplots(1,1,figsize=(8,8))
_ = meta.plot_slitlet(source_id=110003, cutout_size=12.5,
                      rgb_filters=None, ax=ax)

fig.tight_layout(pad=1.0)
fig.show()
(
Source code,png,hires.png,pdf)
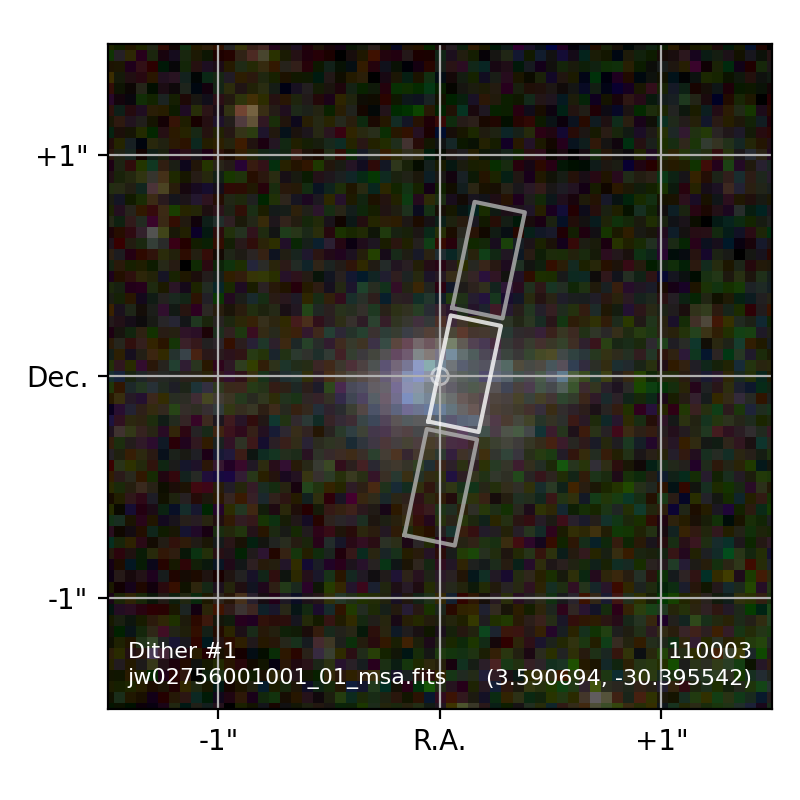
# With RGB cutout

import matplotlib.pyplot as plt
from msaexp import msa

uri = 'https://mast.stsci.edu/api/v0.1/Download/file?uri=mast:JWST/product/'
meta = msa.MSAMetafile(uri+'jw02756001001_01_msa.fits')

fig, ax = plt.subplots(1,1,figsize=(4,4))

filters = ['f200w-clear','f150w-clear','f115w-clear']
_ = meta.plot_slitlet(source_id=110003, cutout_size=1.5,
                      rgb_filters=filters, ax=ax)

fig.tight_layout(pad=1.0)
fig.show()
(
Source code,png,hires.png,pdf)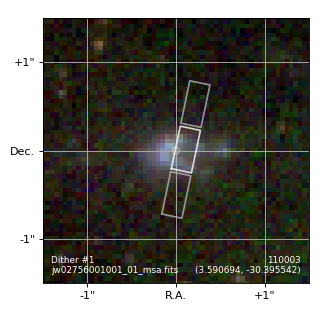
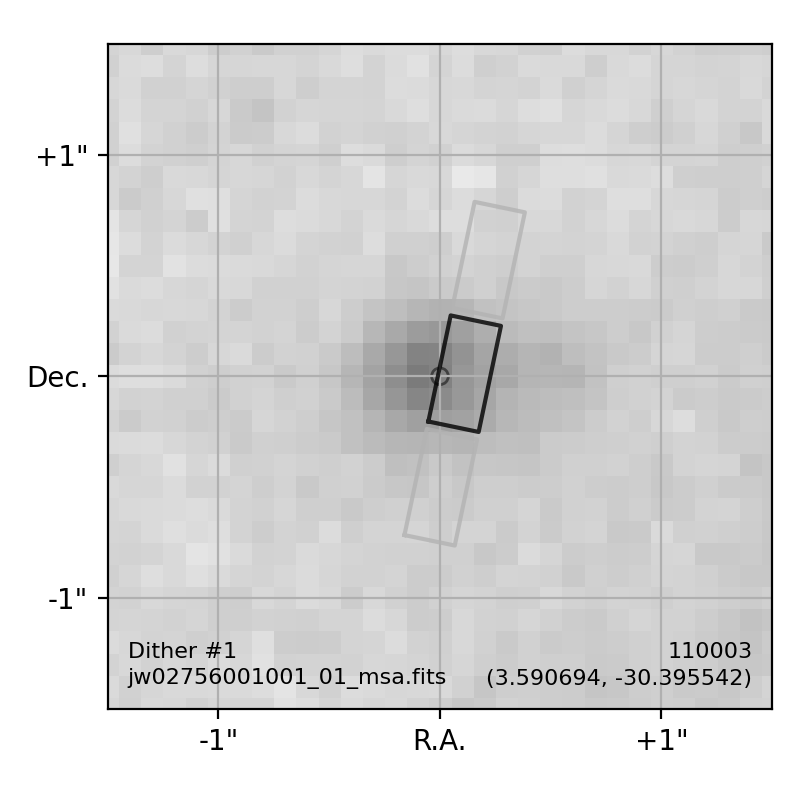
# With grayscale cutout

import matplotlib.pyplot as plt
from msaexp import msa

uri = 'https://mast.stsci.edu/api/v0.1/Download/file?uri=mast:JWST/product/'
meta = msa.MSAMetafile(uri+'jw02756001001_01_msa.fits')

fig, ax = plt.subplots(1,1,figsize=(4,4))

filters = ['f160w']
_ = meta.plot_slitlet(source_id=110003, cutout_size=1.5,
                      rgb_filters=filters, ax=ax, rgb_invert=True)

fig.tight_layout(pad=1.0)
fig.show()
(
Source code,png,hires.png,pdf)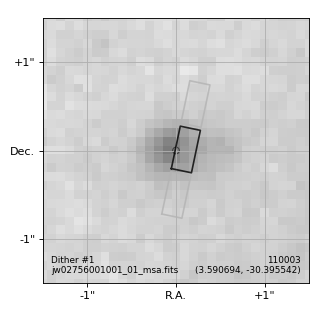
- query_mast_exposures(force=False, **kwargs)[source]
Query MAST database for exposures for this MSA file
- regions_from_metafile(as_string=False, with_bars=True, **kwargs)[source]
Get slit footprints in sky coords
- Parameters
- as_stringbool
Return regions as DS9 region strings
- with_barsbool
Account for bar vignetting
- kwargsdict
Keyword arguments passed to
msaexp.msa.MSAMetafile.get_transforms
- Returns
- String or a list of
grizli.utils.SRegionobjects, depending on as_string
- String or a list of
Examples
>>> from msaexp import msa
>>> uri = 'https://mast.stsci.edu/api/v0.1/Download/file?uri=mast:JWST/product/'
>>> meta = msa.MSAMetafile(uri+'jw02756001001_01_msa.fits')
>>> regs = meta.regions_from_metafile(as_string=True, with_bars=True)
>>> print(regs)
# msametfl = https://mast.stsci.edu/api/v0.1/Download/file?uri=mast:JWST/product/jw02756001001_01_msa.fits
# dither_point_index = 1
# msa_metadata_id = 1
# Q1 N=13  rms= 0.7, 0.4 mas
# Q2 N=29  rms= 1.3, 1.3 mas
# Q3 N=11  rms= 1.3, 0.3 mas
# Q4 N=27  rms= 1.2, 0.7 mas
icrs
polygon(3.623046,-30.427251,3.622983,-30.427262,3.622951,-30.427136,3.623014,-30.427125) # color=lightblue
circle(3.6229814, -30.4270337, 0.2") # color=cyan text={160159}
polygon(3.623009,-30.427106,3.622946,-30.427117,3.622915,-30.426991,3.622978,-30.426980) # color=cyan
polygon(3.622973,-30.426960,3.622910,-30.426971,3.622878,-30.426845,3.622941,-30.426834) # color=lightblue
polygon(3.613902,-30.392060,3.613840,-30.392071,3.613809,-30.391948,3.613871,-30.391936) # color=lightblue
circle(3.6137989, -30.3918859, 0.2") # color=cyan text={160321}
polygon(3.613867,-30.391918,3.613804,-30.391929,3.613774,-30.391805,3.613836,-30.391794) # color=cyan
polygon(3.613831,-30.391775,3.613769,-30.391786,3.613738,-30.391663,3.613800,-30.391652) # color=lightblue
polygon(3.610960,-30.384123,3.610897,-30.384134,3.610867,-30.384011,3.610929,-30.384000) # color=lightblue
...
- regions_from_metafile_siaf(as_string=True, with_bars=True, msa_metadata_id=1, dither_point_index=1, shutter_table=None, meta_keys=['program', 'pi_name', 'proptarg', 'filename', 'filter', 'grating', 'expstart', 'effexptm', 'nod_type', 'final_0x0_EOSA'], source_color='cyan', other_color='lightblue', verbose=False, **kwargs)[source]
MSA shutter regions using pointing info and SIAF shutter transformations
- Parameters
- as_stringbool
Return regions as DS9 region strings
- with_barsbool
Account for bar vignetting
- msa_metadata_id, dither_point_indexint
Exposure definition
- meta_keyslist of str, optional
List of metadata keys to include in the output
- verbosebool, optional
Print verbose messages
- Returns
- String or a list of
grizli.utils.SRegionobjects, depending on as_string
- String or a list of