get_shutter_wavelength_limits
- msaexp.msa.get_shutter_wavelength_limits(col, row, quadrant, grating='prism', filter='clear')[source]
Compute wavelength limits for specific slitlets by MSA row, col, quadrant
- Parameters
- row, col, quadrantscalar, array-like
Shutter definition by MSA column (1-370), row (1-170) and quadrant (1,2,3,4)
- grating, filterstr
Grating and filter names. Currently the PRISM and M grating dispersers are implemented.
- Returns
- tabtable
Table with wavelength limits by detector
[nrs1/nrs2]_wave_[min/max]. The chip gap is the range betweennrs1_wave_maxandnrs2_wave_min.The shutter dependence is calculated from the spectra extracted with msaexp itself. This function is tested to be consistent with the “MSA Target Info” table that can be exported with APT for the PRISM and G395M gratings. However, for the other M gratings this function includes the full wavelength range that can be extracted extending into where the spectral orders can overlap.
If a specified shutter is outside of the convex hull of the “training” data used to derive the mapping, the value in the output table is set to NaN.
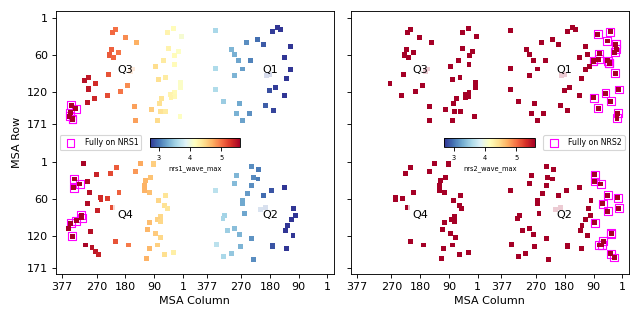
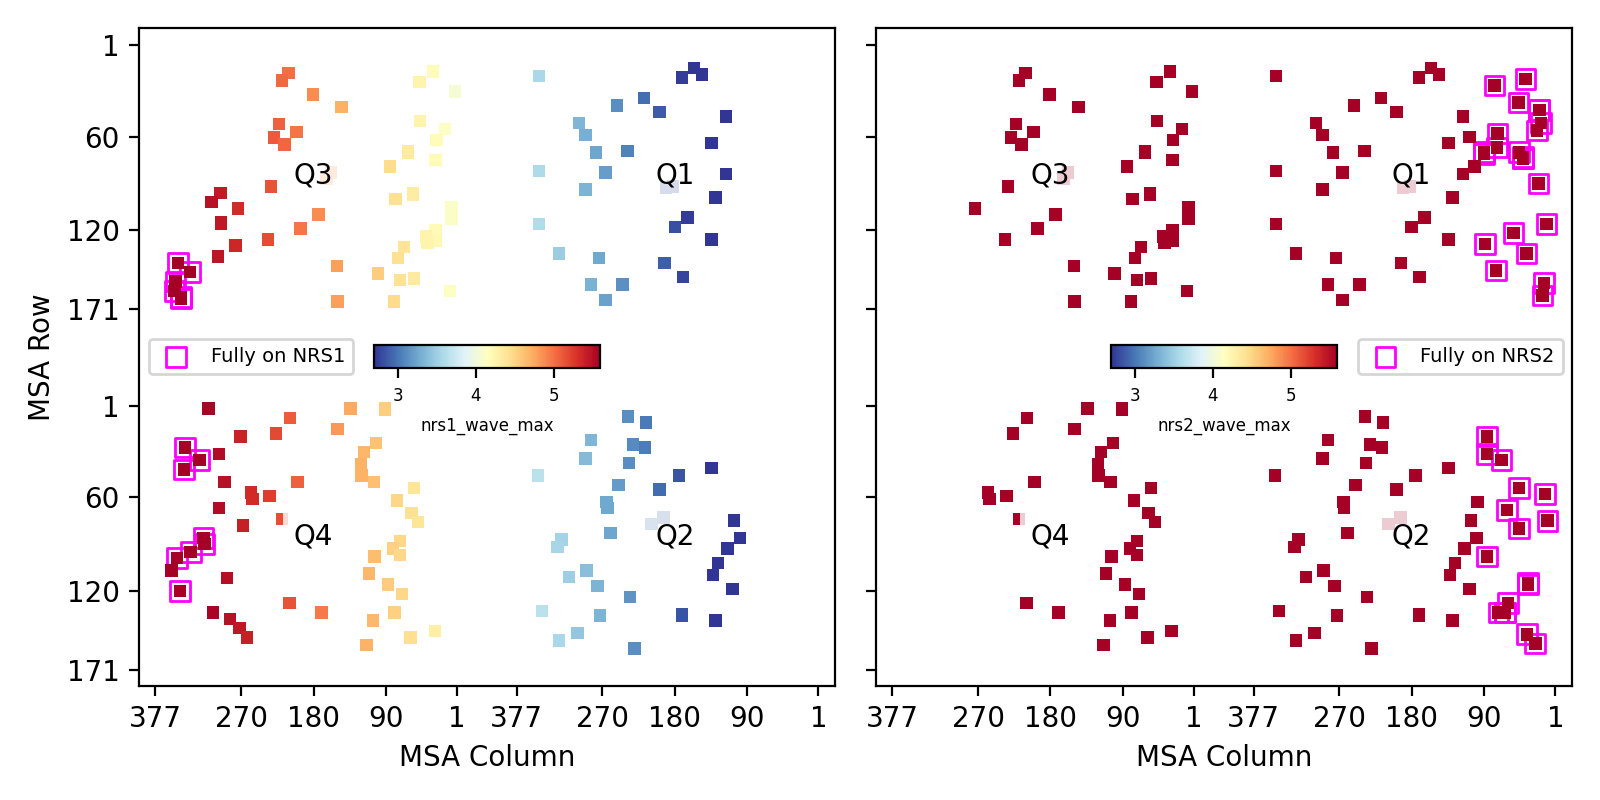
Examples
### Make a plot showing wavelength limits

import numpy as np
import matplotlib.pyplot as plt

from grizli import utils

from msaexp import msa
import msaexp.utils

# APT: Export -> MSA Target Info
apt = utils.read_catalog("https://github.com/gbrammer/msaexp/raw/refs/heads/main/msaexp/tests/data/4233-obs2-exp2-c1_uds_obs2az_g395me2n1-G395M-F290LP.csv")

# Compute wavelength limits by shutter

limits = msa.get_shutter_wavelength_limits(
    apt['Column (Disp)'],
    apt['Row (Spat)'],
    apt['Quadrant'],
    grating='g395m',
    filter='f290lp',
)

fig, axes = plt.subplots(1, 2, figsize=(8,4), sharex=True, sharey=True)

msa.set_msa_axis_ticks(axes[0], "xy")
msa.set_msa_axis_ticks(axes[1], "x")

fig.tight_layout(pad=1)

kws = dict(
    cmap=plt.cm.RdYlBu_r,
    vmin=2.7,
    vmax=5.6,
)

# Plot the MSA layout colored by "wave_max"

# offset columns, rows for plotting
px = apt['Column (Disp)'] + np.isin(apt['Quadrant'], [3, 4]) * msa.DCOL
py = apt['Row (Spat)'] + np.isin(apt['Quadrant'], [2, 4]) * msa.DROW

for i in [1,2]:
    ax = axes[i-1]

    no_gap = limits[f'nrs{i}_wave_min'] < 2.7
    no_gap &= limits[f'nrs{i}_wave_max'] > 5.6

    ax.scatter(
        px[no_gap],
        py[no_gap],
        ec='magenta',
        fc='None',
        marker='s',
        s=50,
        label=f'Fully on NRS{i}',
    )

    _ = msa.plot_msa_shutters(
        apt['Column (Disp)'],
        apt['Row (Spat)'],
        apt['Quadrant'],
        c=limits[f'nrs{i}_wave_max'],
        ec='None',
        ax=ax,
        marker='s',
        s=20,
        **kws,
    )

    sc = ax.scatter(-99, -99, c=[5], **kws)
    _ = msaexp.utils.tight_colorbar(
        sc, fig, ax, loc='cc', sy=0.02, labelsize=6,
        label=f"nrs{i}_wave_max",
    )

    leg = ax.legend(
        loc='center ' + ['left', 'right'][i-1],
        fontsize=7,
    )

    for q in [1,2,3,4]:
        ax.text(
            180 + (q in [3,4]) * msa.DCOL,
            85 + (q in [2,4]) * msa.DROW,
            f'Q{q}',
            ha='center', va='center',
            bbox={'fc':'w', 'ec': 'None', 'alpha': 0.8},
        )
(
Source code,png,hires.png,pdf)