General notes
Detector gaps for MSA planning
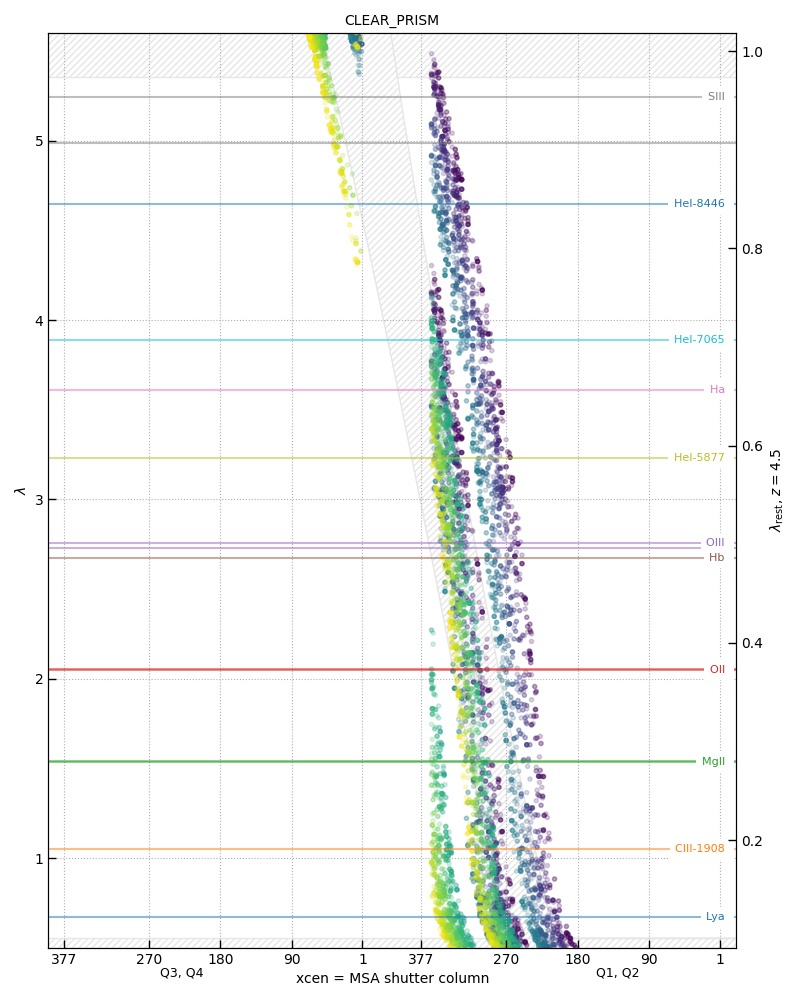
We have used the database of spectra extracted with MSAEXP to make reference figures to show how the wavelengths that will be missed in the detector gaps vary with the shutter location in the MSA.
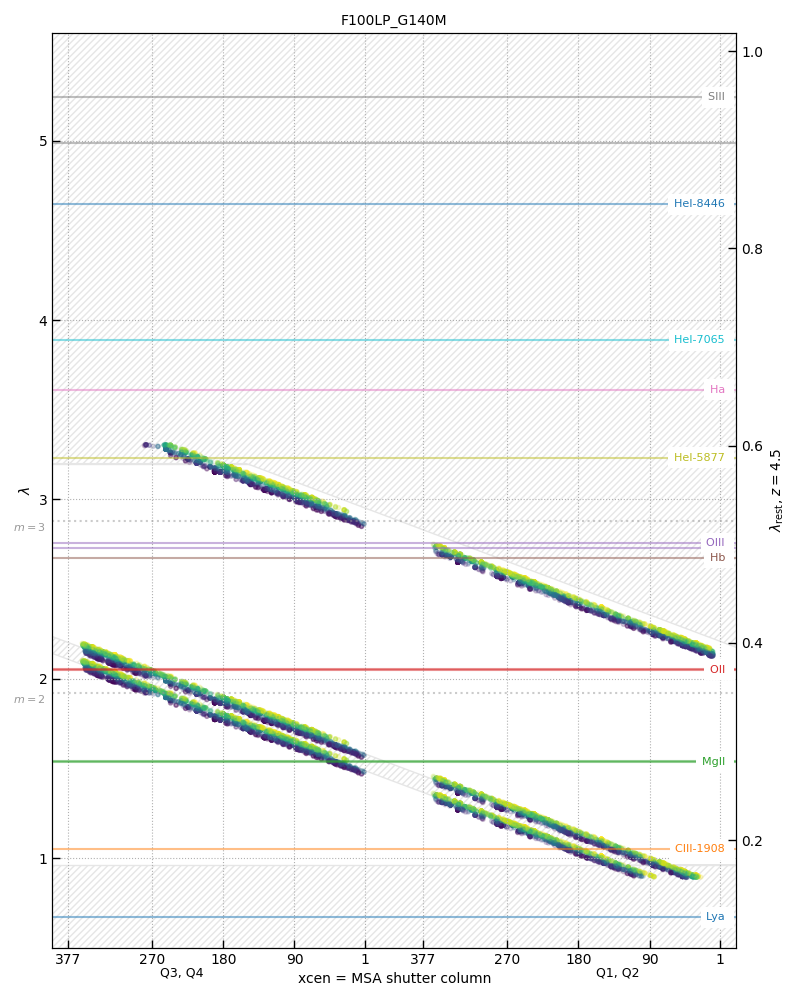
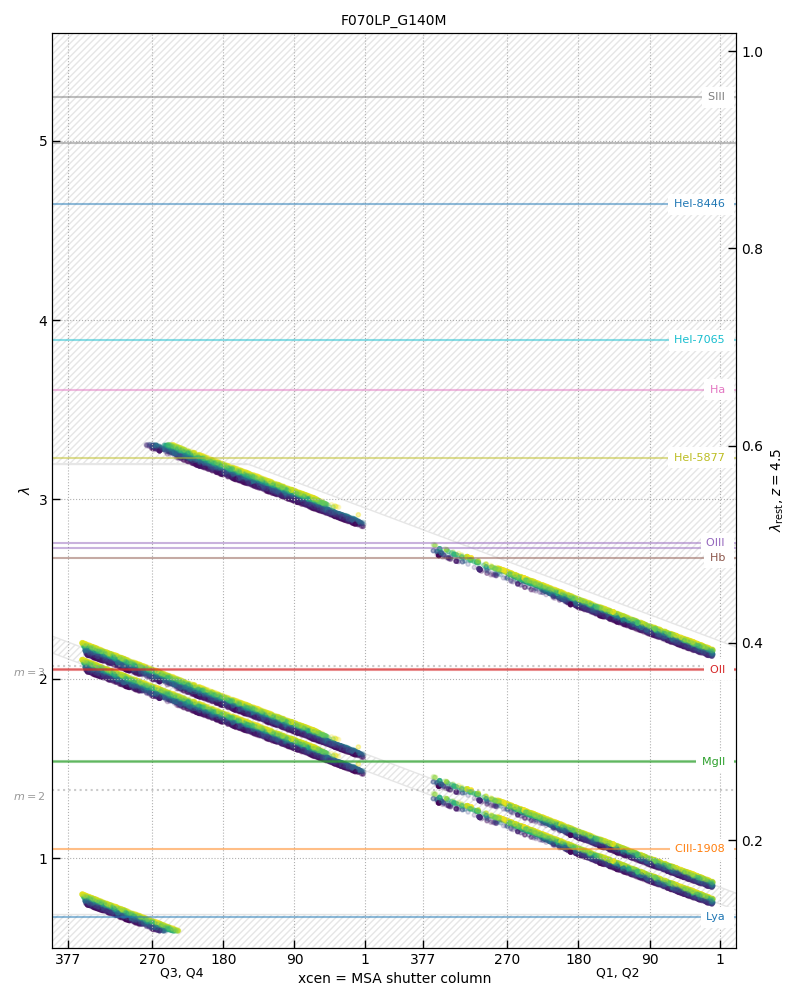
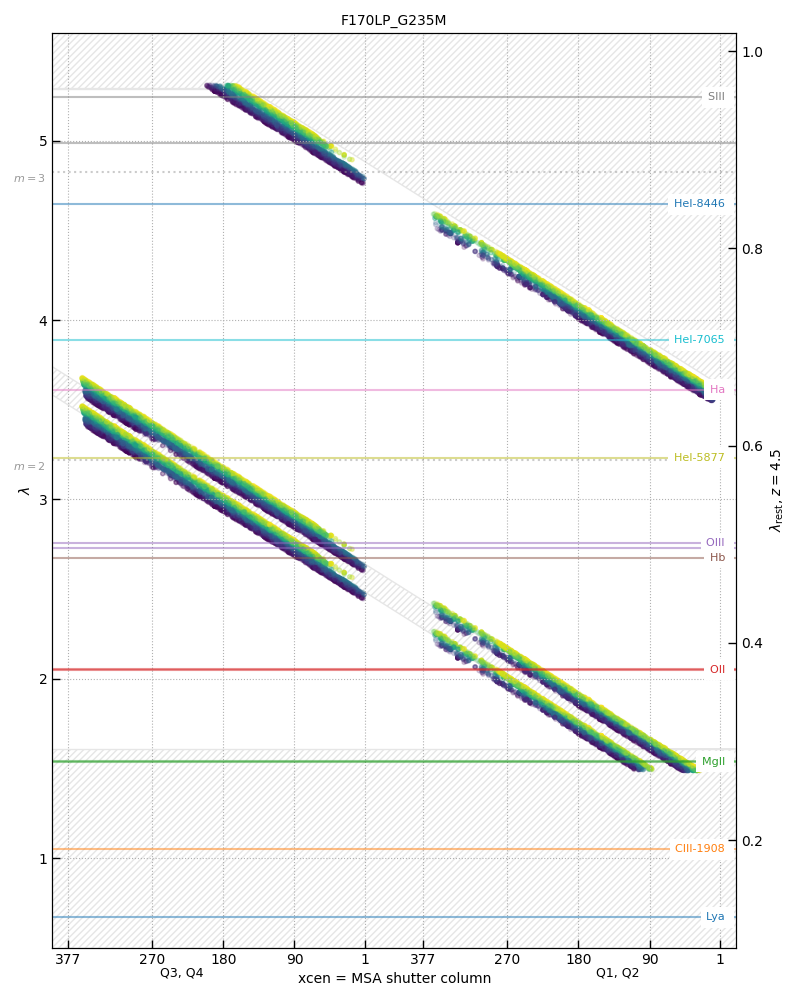
The figure below shows the result for the F100LP_G140M filter+grating combination. The horizontal axis is the MSA shutter column coordinate with the ordering as it would appear on the APT MSA visualization tool. The plotted points are the minimum and maximum wavelengths of the extracted msaexp spectra colored by shutter row, perhaps from both detectors for a source in a given shutter. The white areas of the image therefore shows wavelengths covered by the spectra at a given MSA column. There is only a small dependence on the coverage as a function of MSA row.
The wavelengths where the 2nd and 3rd order spectra begin to overlap with the first are labeled m = 2 and m=3. The latest DJA/msaexp reductions extend the extractions into this overlap area, and the order contamination is relatively minor for sources as red as even typical galaxies (and worst for blue MW stars).
All filter+grating combinations are shown below.
Note that there is more dependence of the gap location on shutter row for the PRISM. The safest regions with complete spectra are x > 90 in Q3, Q4 and x < 180 in Q1, Q2.
A function is provided in msaexp.msa.get_shutter_wavelength_limits to programatically calculate the wavelength limits for PRISM and M-grating shutters. See the notes on PR98 where the function was implemented for information on using it with the APT export products.
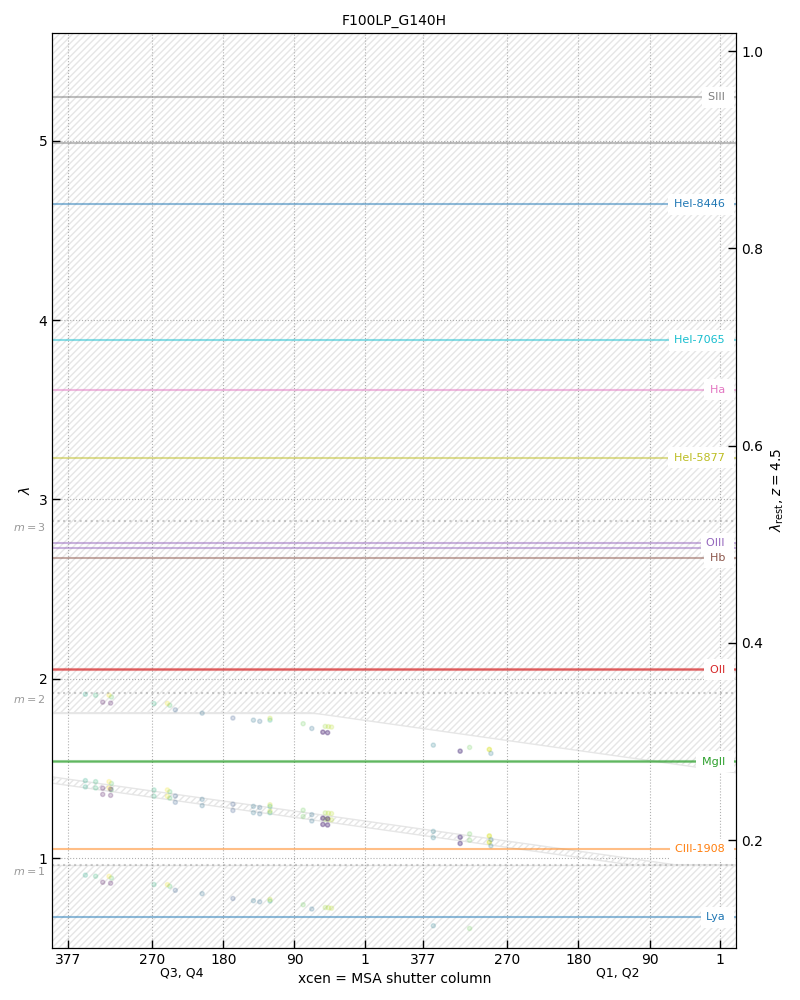
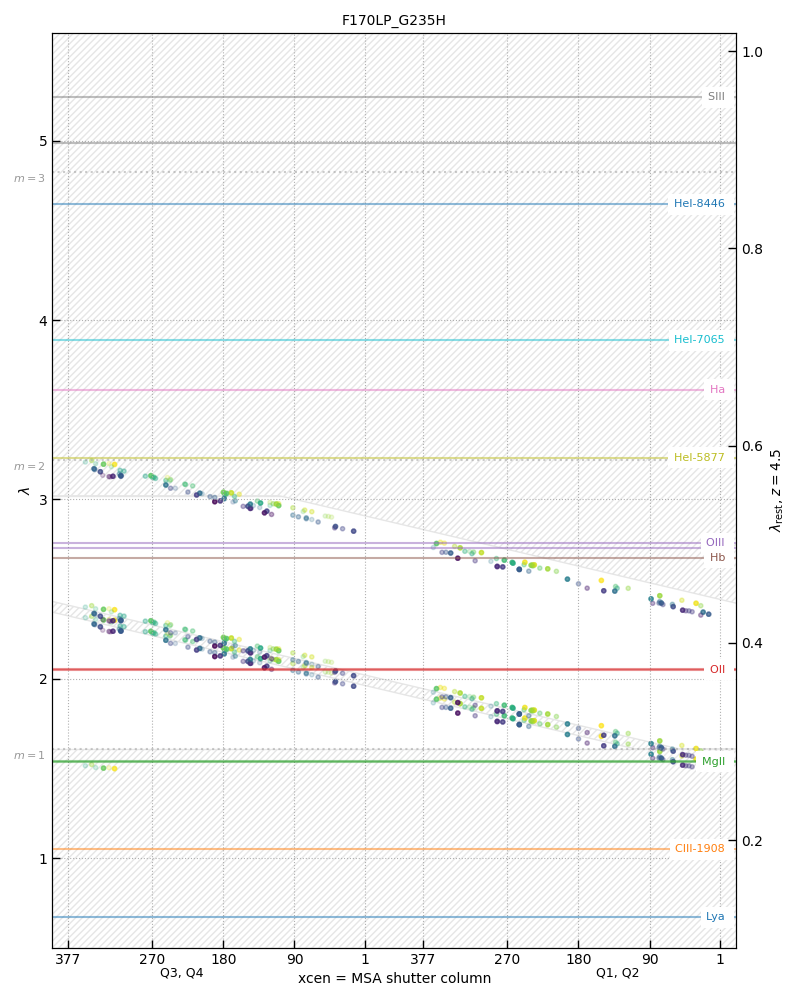
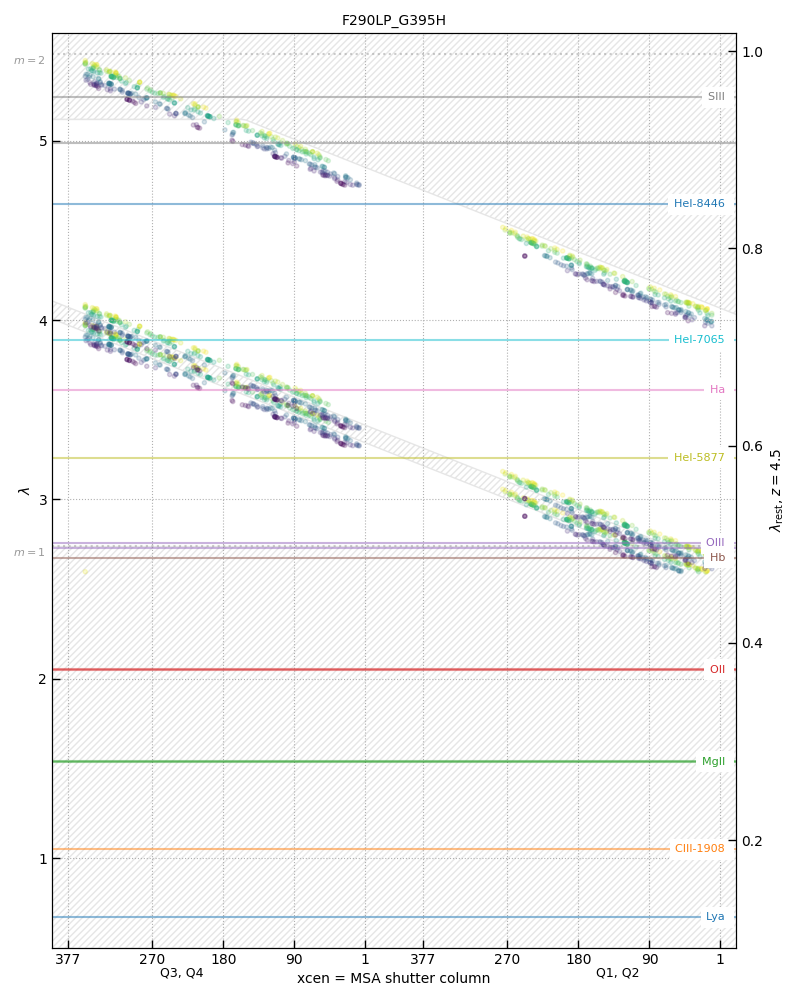
M Gratings

H Gratings